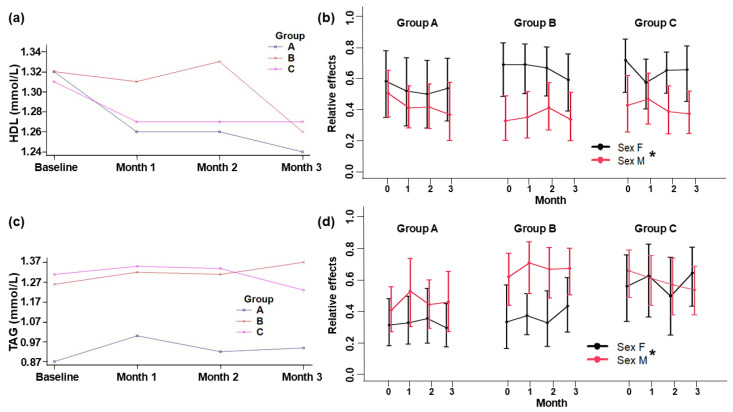
Figure 3.
Plasma levels of HDL-cholesterol (a) and triacylglycerols (c). Relative effects of plasma HDL-cholesterol (b) and triacylglycerols (d) in adult subjects at baseline and 1, 2, and 3 months of intervention. Group A: Yogurt with SIO. Group B: Yogurt with HPO. Group C: Yogurt control (placebo). Data are means ± standard deviation. * Indicates a significant difference by sex (p ≤ 0.05).

