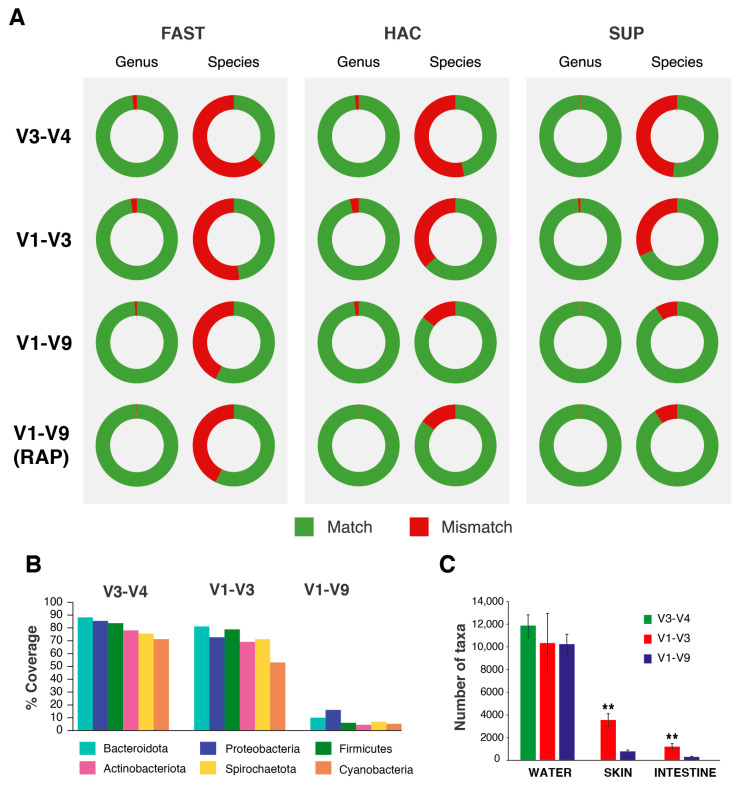
Figure 3.
In silico and in vivo primer performance. (A) Pie plots representing the percentage of reads in known taxonomy samples (mock community and positive controls) assigned correctly to genus and species level in each one of the library–primer–basecalling combinations used in the study. (B) Bar plots showing the percentage of taxonomies of the 6 dominant phyla in aquaculture-related samples matched in SILVA after in silico hybridisation of each set of primers used in this study. (C) Effect of primer choice on the number of taxa found in water, skin, and intestine samples of this study (One-way ANOVA + Tukey’s post-test, ** p < 0.001).

