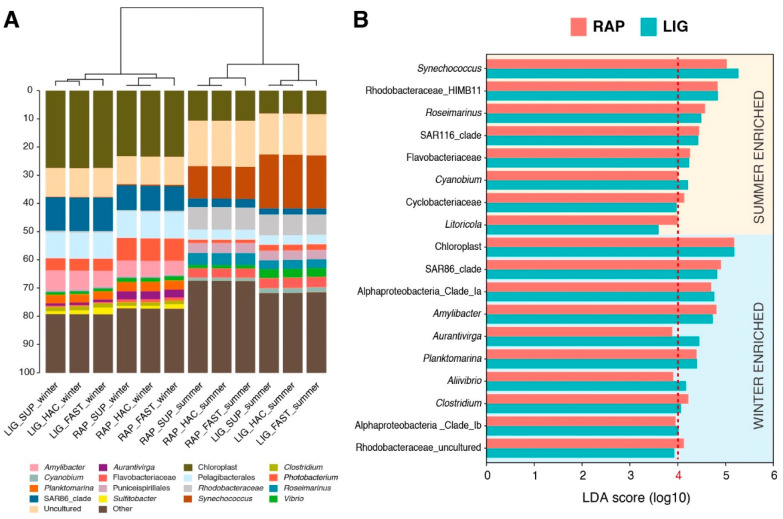
Figure 5.
(A) Clustered stacked barplots showing relative abundances (sequence-based) of the most abundant genera (>1%) in summer and winter-extracted water samples. Clustering was based on Pearson correlation analysis (p < 0.05). Taxa with less than 1% abundance were included together in the group labelled Other. (B) Linear discriminant analysis effect size analysis performed at the level of genus representing the significant biomarkers for each group and their LDA score (log10).

