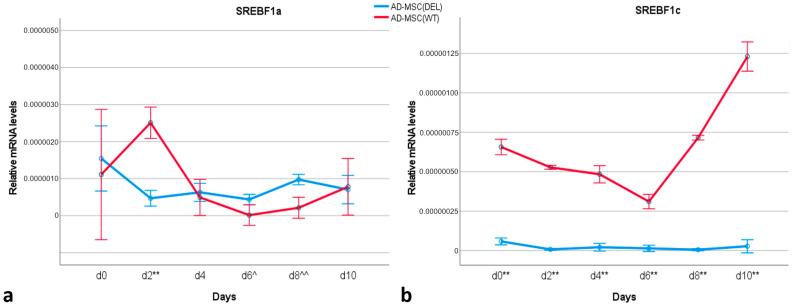
Figure 5.
Relative transcript levels of SREBF1a (a) and SREBF1c (b) during subsequent days of adipogenesis. The error bars represent 95% confidence intervals. **: significantly higher in AD-MSCWT than in AD-MSCDEL, p < 0.001; ^^: significantly lower in AD-MSCWT than in AD-MSCDEL, p < 0.001; ^: significantly lower in AD-MSCWT than in AD-MSCDEL, p < 0.05.

