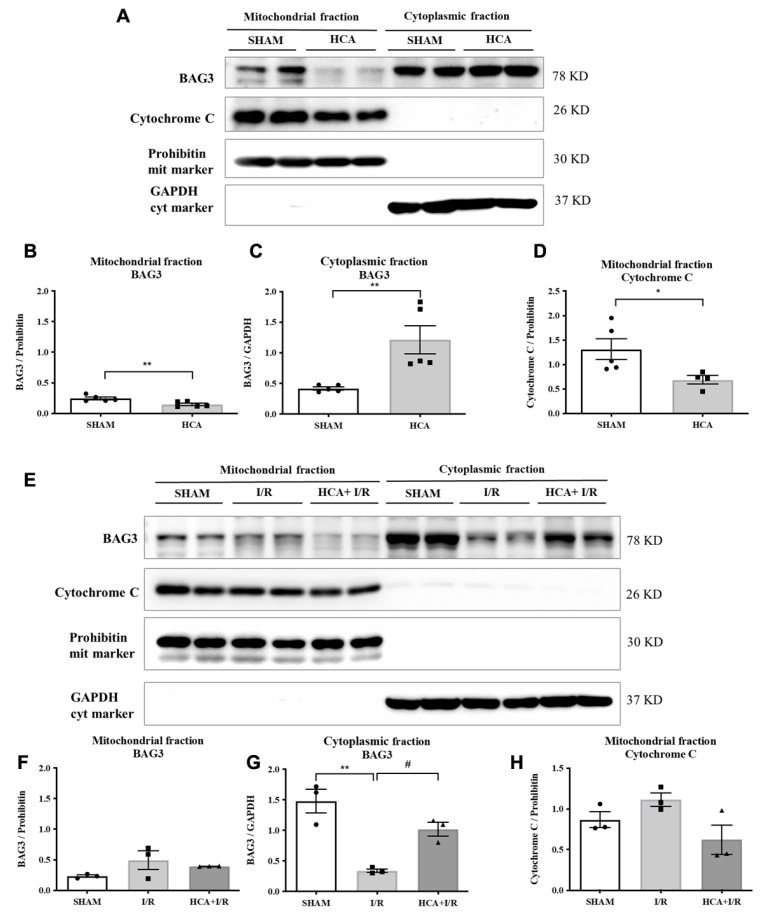
Figure 2.
Effect of HCA preconditioning on mitochondrial and cytosolic BAG3 expression in sham, HCA, I/R, and HCA+I/R groups. (A) Original graphs of cytosolic and mitochondrial BAG3 expression in sham and HCA hearts, determined via Western blot assay. Translocation of mitochondrial BAG3 (B) to cytosolic BAG3 (C) and translocation of mitochondrial cytochrome C (D) are noted between sham and HCA hearts. (E) Original traces of mitochondrial and cytosolic BAG3 expression. Significantly reduced cytosolic BAG3 expression is observed in I/R group vs. sham group, whereas significantly preserved cytosolic BAG3 is observed in HCA+I/R group vs. I/R group (G). Mitochondrial fractions of BAG3 expression (F) and cytochrome C expression (H) are not significantly different among sham, I/R, and HCA+I/R groups. Each symbol represents the respective individual. All data are expressed as mean ± SEM (n = 3–5). * indicates significance vs. sham group (* p < 0.05; ** p < 0.01). # indicates significance vs. I/R group (# p < 0.05).

