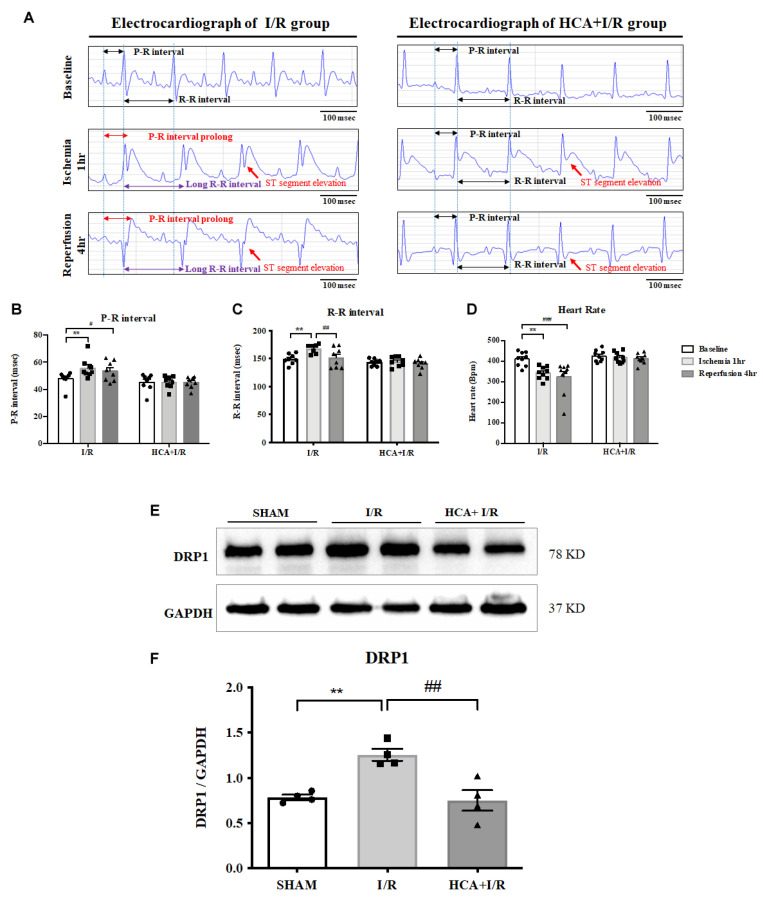
Figure 5.
Effect of HCA preconditioning on cardiac I/R-affected EKG parameters and mitochondrial fission. (A) Representative EKG graphs in ST segment, with P-R and R-R intervals, in I/R and HCA+I/R groups. Statistical data for P-R intervals (B), R-R intervals (C), and heart rate (D). Expression of the mitochondrial fission marker DRP1 protein (E) in the three groups and statistical data (F). All data are expressed as mean ± SEM (n = 8). * indicates significance vs. sham group (** p < 0.01). # indicates significance vs. I/R group (# p < 0.05; ## p < 0.01; ### p < 0.001).

