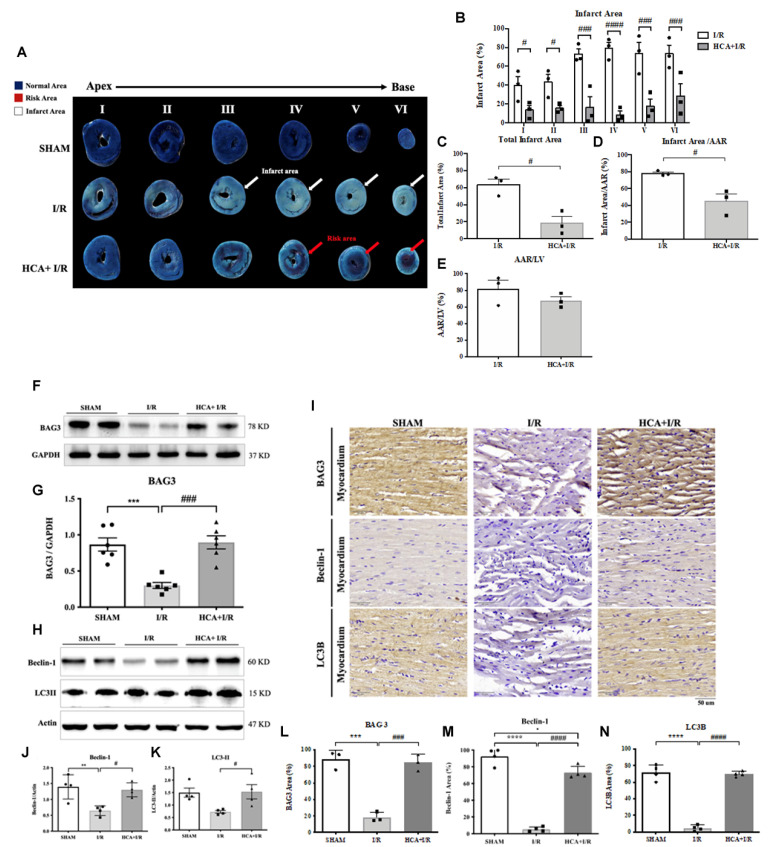
Figure 7.
Effect of HCA preconditioning on cardiac I/R-induced infarct size, BAG3, and autophagy expression among the three groups. The typical infarct areas of I-VI sections among the three groups are displayed in (A). Percentages of six sections of infarct area in I/R and HCA+I/R groups are indicated in (B). Total infarct area (C), infarct area/AAR (D), and AAR/LV (E) are demonstrated. Cardiac BAG3 expression (F,G), Beclin-1 (H,J), and LC3II (H,K) examined via Western blot analysis are also shown. Immunohistochemistry of BAG3, Beclin-1, and LC3II is shown in (I). Statistical analysis of BAG3, Beclin-1, and LC3II in the three groups is shown in (L–N), respectively. All data are expressed as mean ± SEM (n = 3). * indicates significant differences vs. sham group (** p < 0.01; *** p < 0.001; **** p < 0.0001). # indicates significant differences vs. I/R group (# p < 0.05; ### p < 0.001; #### p < 0.0001).

