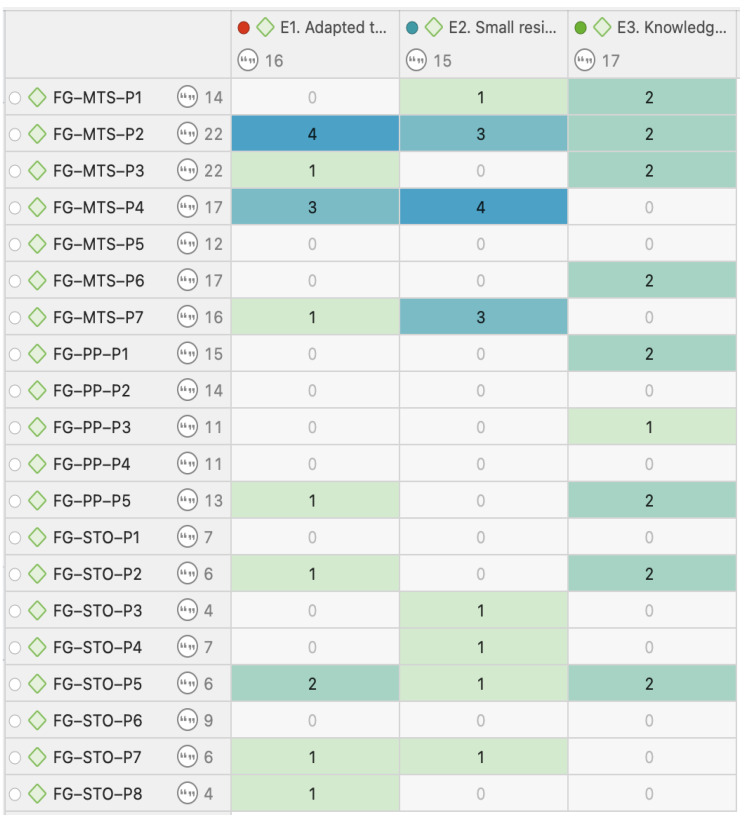
Figure 4.
Co-occurrence of codes for emerging issues and intervening individuals from the FGs. Each row represents a participant from the focus groups. Each column corresponds to a question code for emerging issues. The intensity of the color in each cell indicates the frequency of responses or co-occurrence of codes, with darker colors representing higher frequency. Source: Own elaboration.

