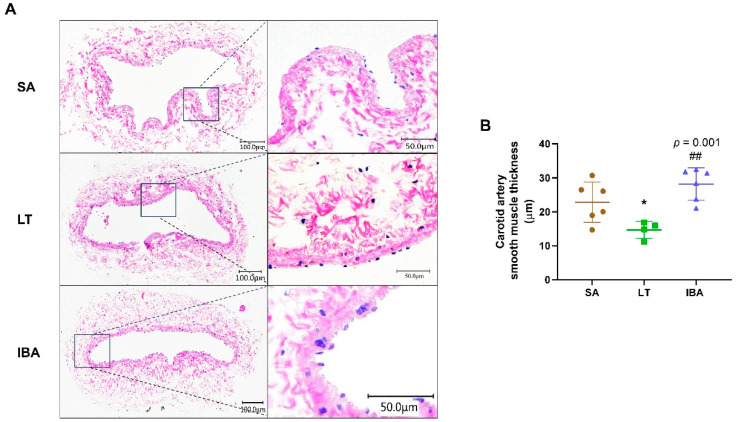
Figure 1.
HE staining results for carotid arteries in ground squirrels. (A) Typical images of HE staining of carotid arteries at three different groups. Tissue scales in the left column are 100 µm and in right column are 50 µm, (B) intima-medial measure thickness at three random locations on each carotid artery. SA: summer active, LT: late torpor, IBA: interbout arousal. n = 4~6. Data are mean ± SD. Statistically significant differences are denoted as follows: * p < 0.05, as compared with the SA group and ## p < 0.01, as compared with the LT group.

