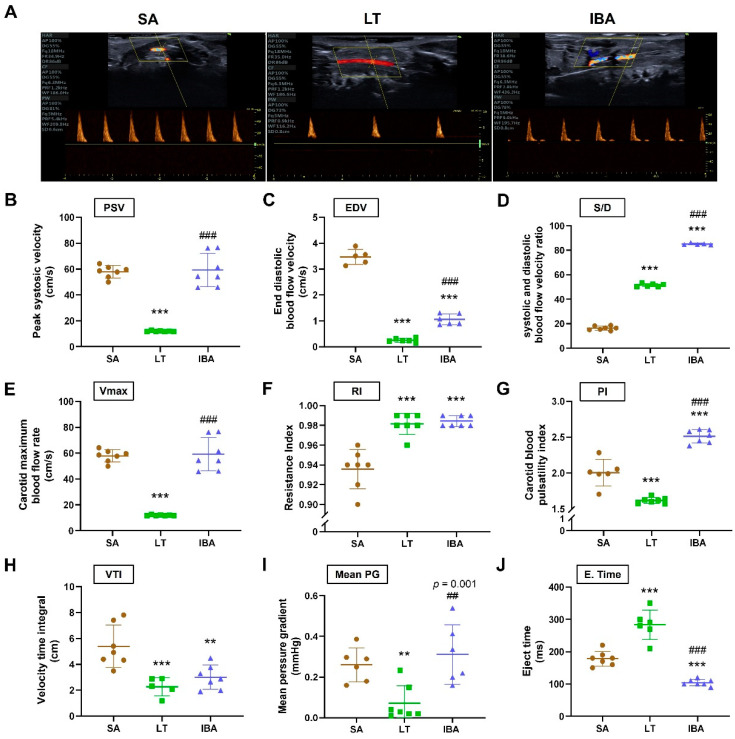
Figure 2.
Hemodynamics of carotid arteries in ground squirrels. (A) Typical images of carotid artery hemodynamics at three different groups, (B) peak systolic velocity (PSV, cm/s), (C) end diastolic blood flow velocity (EDV, cm/s), (D) systolic and diastolic blood flow velocity ratio (S/D), (E) maximum carotid blood flow rate (Vmax, cm/s), (F) resistance index (RI), (G) carotid arteries pulsatility index (PI), (H) velocity time integral (VTI, cm), (I) mean pressure gradient (mean PG, mmHg), (J) ejection time (E. time, ms). SA: summer active, LT: late torpor, IBA: interbout arousal. n = 6~7. Data are mean ± SD. Statistically significant differences are denoted as follows: ** p < 0.01, *** p < 0.05, as compared with the SA group, and ## p < 0.01, ### p < 0.001, as compared with the LT group.

