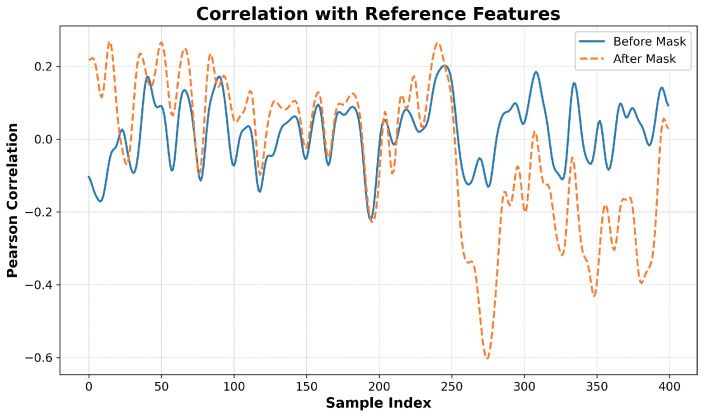
Figure 9.
Correlation analysis of the before and after masked fusion features by PPO with the reference features, which consist of ‘GC Content’, ‘CpG Islands’, and ‘nucleotide composition’. The y-axis represents the Pearson correlation coefficient, and the x-axis denotes the sample index from the independent dataset.

