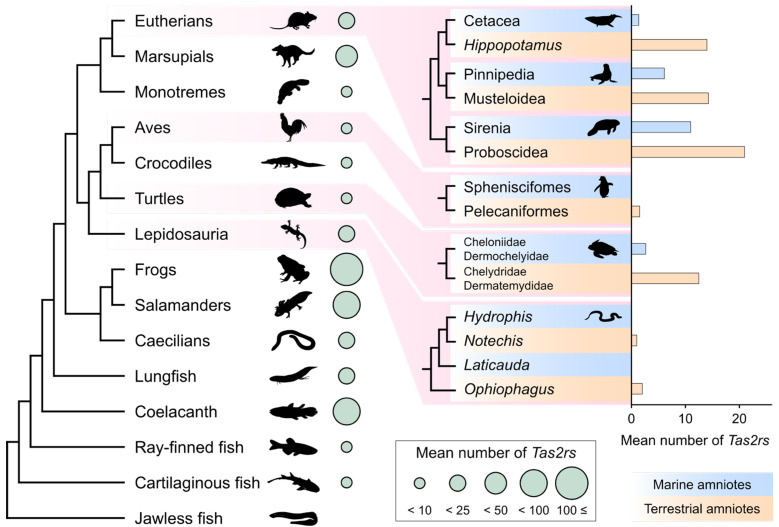
Figure 2.
Variation of Tas2r gene number in vertebrates. The mean number of Tas2rs in major vertebrate lineages is represented as different sized circles. The inset bar plot shows that the comparisons of the mean number of Tas2rs between marine and terrestrial amniotes are represented as bar plots. Data were retrieved from Policarpo et al. (The number of complete Tas2rs with a predicted seven-transmembrane topology from the whole-genome assembly with > 80% BUSCO gene completeness) [8]. The animal silhouettes are obtained from PhyloPic (https://www.phylopic.org/, accessed on 28 May 2024). The silhouettes of the Tasmanian devil and platypus drawn by Sarah Werning are reused under the CC BY 3.0 (https://creativecommons.org/licenses/by/3.0/). The silhouette of Hydrophis curtus drawn by Christina Zdenek and the manatee drawn by Flurin Leugger are reused under CC BY 4.0 (https://creativecommons.org/licenses/by/4.0/).

