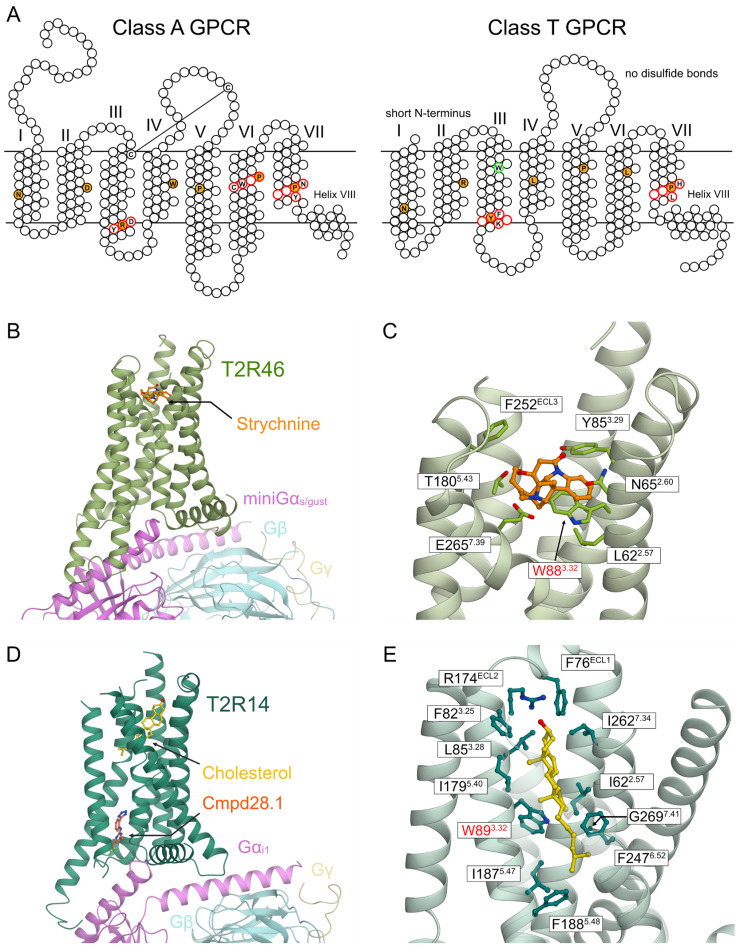
Figure 5.
Three-dimensional structures of T2Rs. (A) The snake plots of class A and T GPCRs. The residues filled by orange indicate X.50 residues (generic residue numbering), most conserved residues of each transmembrane domain for each GPCR class. Residues colored in red and green indicate conserved sequence motifs and a key residue for ligand binding, respectively. (B) The overall structure of T2R46 complexed with strychnine retrieved from the PDB (7XP6). (C) The binding mode of strychnine to T2R46 retrieved from the PDB (7XP6). (D) The overall structure of T2R14 complexed with cholesterol and cmpd28.1 (an analog of fulfenamic acid) retrieved from the PDB (8VY7). (E) The binding mode of cholesterol to T2R14 retrieved from the PDB (8VY7). The illustrations were drawn using CueMol2 (http://www.cuemol.org/, downloaded on 24 May 2024).

