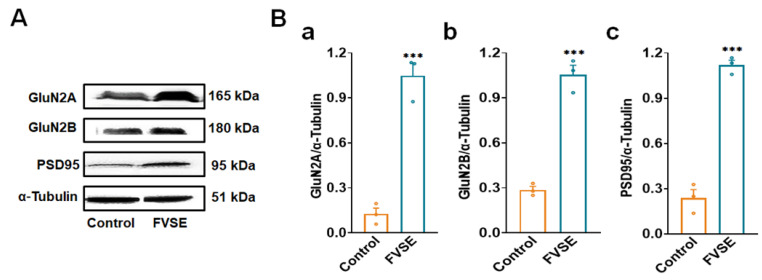
Figure 8.
Analysis of Synaptic Protein Expression in the Cortex of 5-Week-Old ICR Mice Treated with FVSE. (A) Representative Western blot images showing the levels of GluN2A, GluN2B, PSD95, and the loading control α-Tubulin in cortical tissue from control and FVSE-treated groups. (B) Quantitative analysis of Western blot band intensity normalized to α-Tubulin for (a) GluN2A, (b) GluN2B, and (c) PSD95. Data are expressed as mean ± S.E.M. from four mice per group. Statistically significant differences compared to the control group are indicated by *** p < 0.001 (Student’s t-test).

