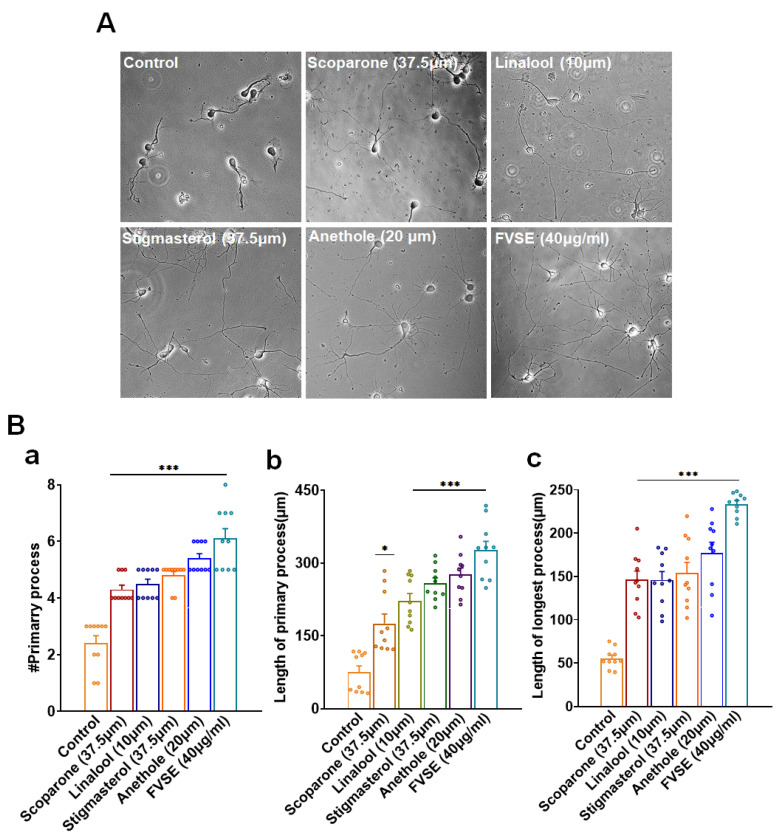
Figure 10.
(A) Bright-field images illustrating the neuritogenetic effects of various treatments, including Scoparone (37.5 μM), Linalool (10 μM), Stigmasterol (37.5 μM), Anethole (20 μM), and FVSE (40 μg/mL), compared to the control. Neurite outgrowth is visible across the different treatments, with the scale bar representing 50 μm. (B) Quantitative analysis of morphometric parameters, including (a) the number of primary neurites per neuron, (b) the length of the primary neurites, and (c) the length of the longest neurite. Data are presented as the mean ± standard error of the mean (S.E.M.) from three independent experiments (n = 3, with 10 neurons per experiment). Statistical significance was determined using one-way analysis of variance (ANOVA), with * p < 0.05 and *** p < 0.001 indicating levels of significance.

