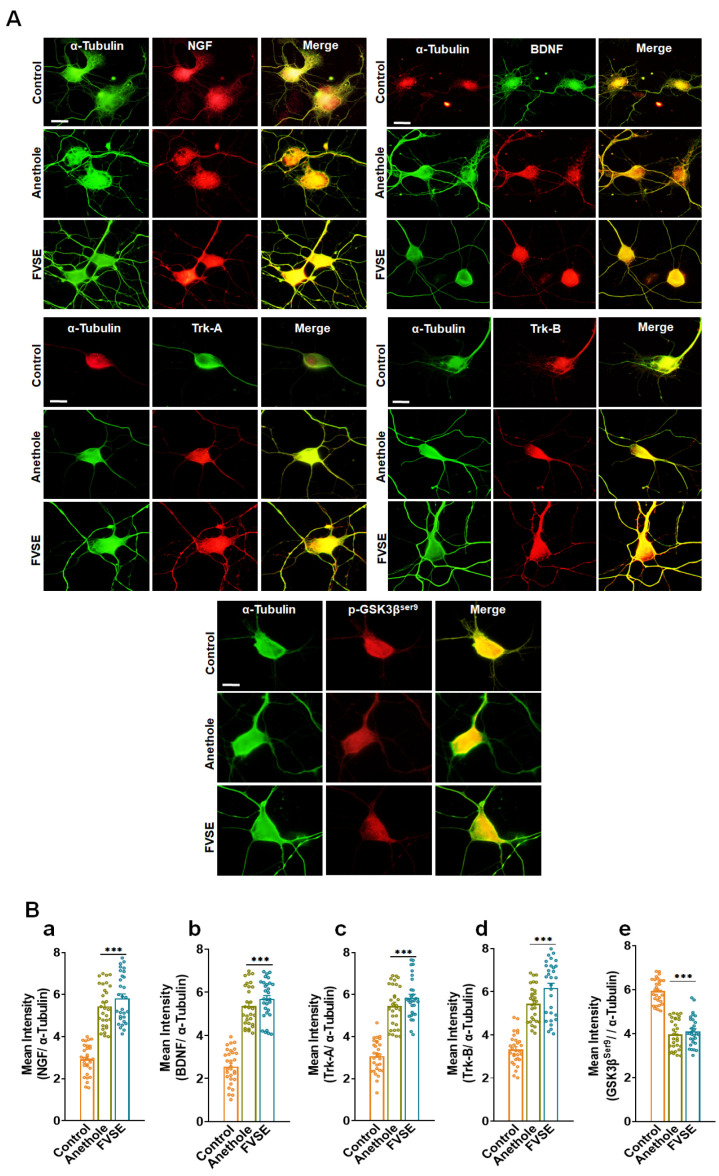
Figure 11.
Immunofluorescence Characterization of Neurotrophin Signaling Proteins in Primary Cultured Neurons. (A) Representative fluorescence images of neurons labeled with α-tubulin (green) as a structural marker, alongside neurotrophin proteins (red): NGF, BDNF, Trk-A, Trk-B, and GSK3βser9. Merged images show areas of co-localization (yellow), indicating overlap between α-tubulin and the specific neurotrophin markers. Scale bar represents 50 µm. (B) Quantitative analysis of mean fluorescence intensity for neurotrophin markers relative to α-tubulin expression: (a) NGF, (b) BDNF, (c) Trk-A, (d) Trk-B, and (e) GSK3βser9. Data are expressed as mean ± S.E.M. from three independent experiments with 30 neurons per group. Statistical significance is denoted by *** p < 0.001 (Student’s t-test).

