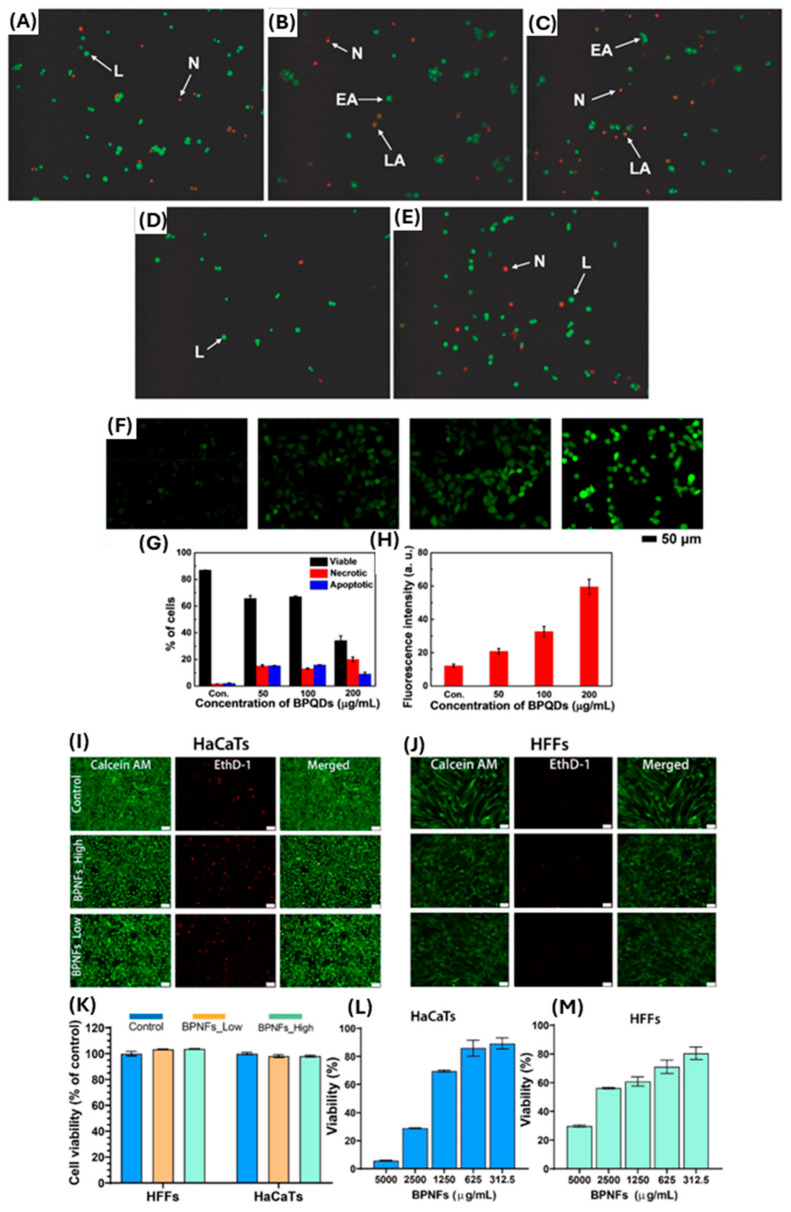
Figure 4.
(A–E) AO/EB staining of HCoEpiC cells after 24 h exposure of layered BP observed by inverted fluorescence microscopy at various concentrations. The figure panels: (A) control and (B–E) 10 µg mL−1–50 µg mL−1). The arrows on these panels are as follows: L: live cells; EA: early apoptotic cells; LA: late apoptotic cells; N: necrotic cells. Adapted with permission from [63]. (F–H) show cell apoptosis and oxidative stress on HeLa cells; (F) intracellular ROS production in cells treated with the different concentrations (0, 50, 100, and 200 μg/mL) of BPQDs. (G,H) The corresponding analysis on percentage of cells and fluorescence intensity of ROS level, adapted from [64] with permission. (I–M) The panel shows the effect of BPNFs on in vitro skin cell viability at moderate concentrations. (I,J) Shows representative images of HaCaTs and HFFs stained with Calcein AM (green), and dead cells stained with EthD-1 (red) following 24 h of treatment with BPNFs low (1000 µg mL−1) and BPNFs high (1500 µg mL−1). (K–M) The corresponding cell viability after treatment for both skin cells at low and high concentrations compared to control. Data adapted with permission from [12]. Scale bar 50 µm. Data are shown as means ± SEM.

