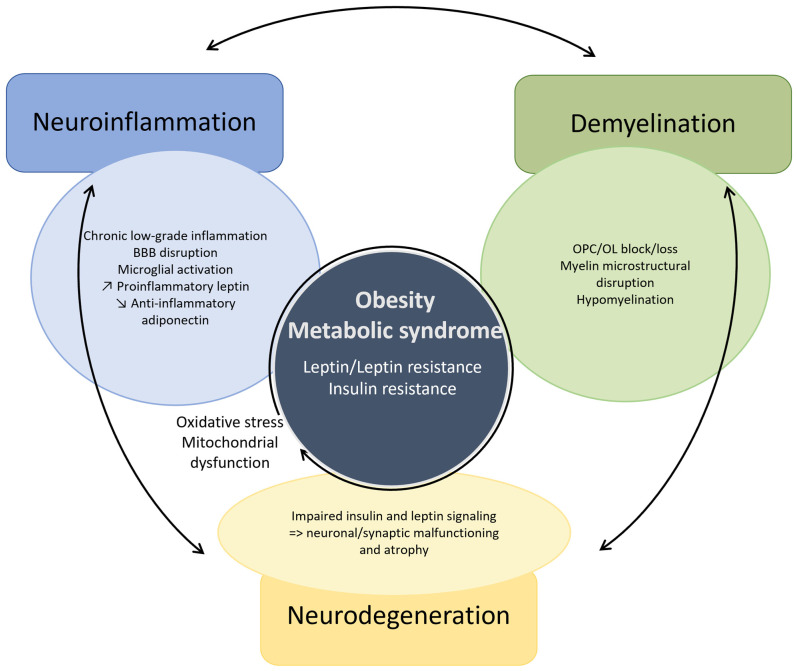
Figure 6.
Triangulation of neuroinflammation, demyelination, and neurodegeneration in metabolic syndrome with key mechanisms that self-sustain these processes but also influence each other mutually. The bubbles list pathophysiological mechanisms by which each process (with corresponding color) impacts at least one of the two other processes, while the bubble in the middle highlights peculiar pathophysiological mechanisms involved in all processes. BBB = blood–brain barrier, OPC = oligodendrocyte progenitor cell, OL = oligodendrocyte, ↗ = increased, ↘ = decreased.

