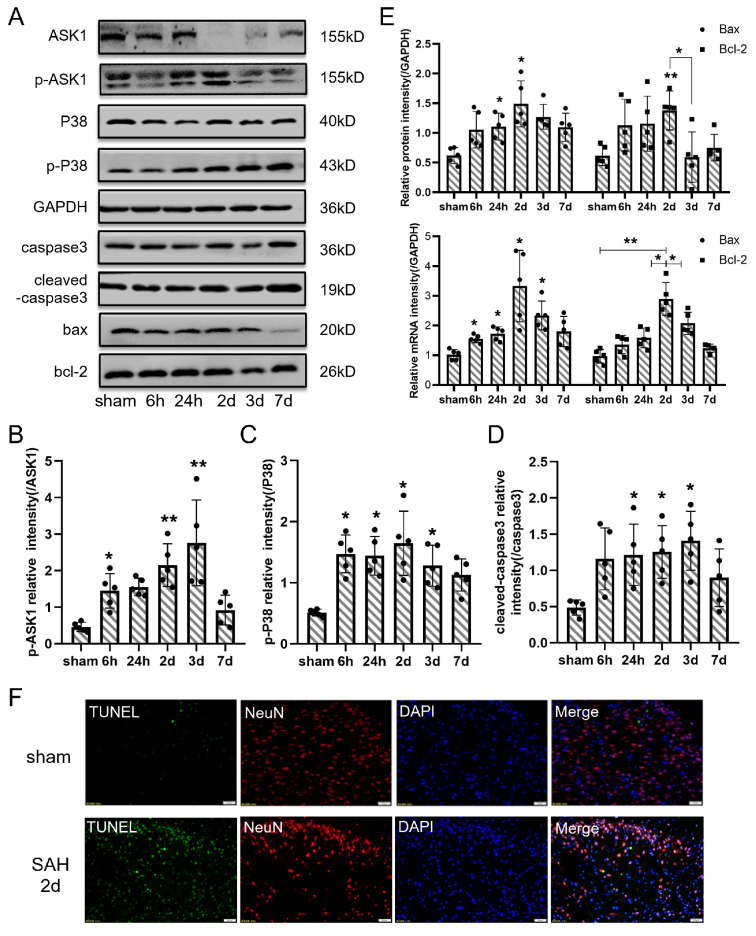
Figure 3.
The apoptosis pathway was activated after SAH. (A) Representative bands of ASK1, p-ASK1, P38, p-P38, caspase3, cleaved-caspase3, Bax, and Bcl-2 expression in the cortex at each time point after SAH. (B–D) Quantitative analysis of Western blot results showed that the ratio of p-ASK1/ASK1, p-P38/P38 and cleaved-caspase3/caspase3 were significantly increased after SAH. (E) Quantitative analysis of Western blot and qPCR results showed that the protein and mRNA levels of Bax and Bcl-2 were increased after SAH. (F) Representative TUNEL staining in the cortex of right temporal lobe after SAH (TUNEL, green; NeuN, red; DAPI, blue). Bars represent the means ± SD. * p < 0.05; ** p < 0.01; vs. sham (n = 5 in each group). Bar = 50 μm.

