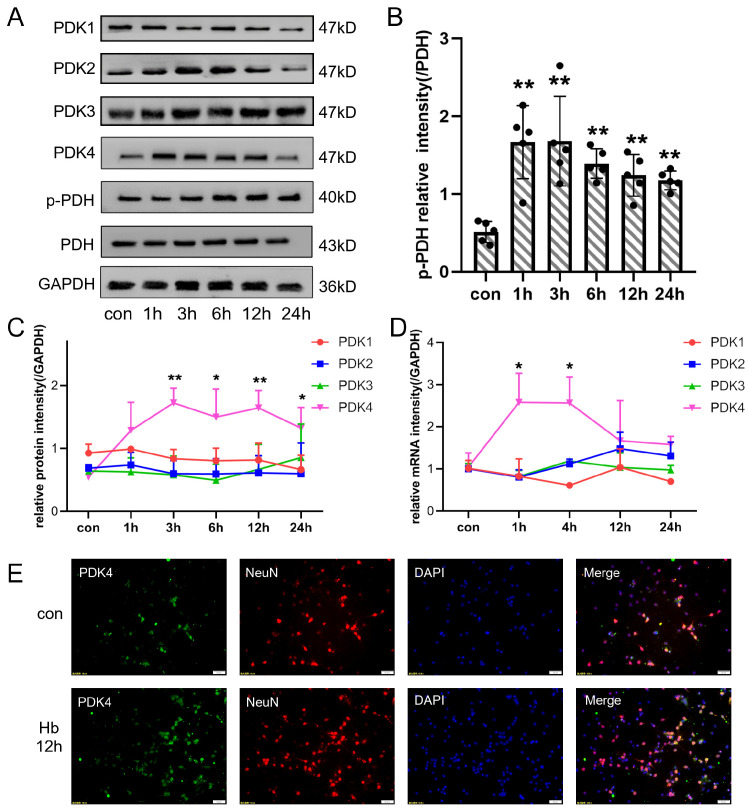
Figure 4.
The expression of PDKs in cultured primary neurons after Hb stimulation. (A) Representative bands of PDK1, PDK2, PDK3, PDK4, PDH, and p-PDH expression at each time point (0, 1, 3, 6, 12, and 24 h) after Hb stimulation. (B) Quantitative analysis of Western blot results showed that the ratio of p-PDH/PDH was significantly increased after Hb stimulation. (C,D) Quantitative analysis of Western blot and qPCR results showed that variation of PDKs protein at each time point (0, 1, 3, 6, 12, and 24 h) and mRNA at each time point (0, 1, 4, 12, and 24 h) levels after Hb stimulation. (E) Representative immunofluorescence staining for PDK4 and NeuN (a neuronal marker) in cultured primary neurons after Hb stimulation (PDK4, green; NeuN, red; DAPI, blue). Bars represent the means ± SD. * p < 0.05; ** p < 0.01 vs. con (n = 5 in each group). Bar = 50 μm.

