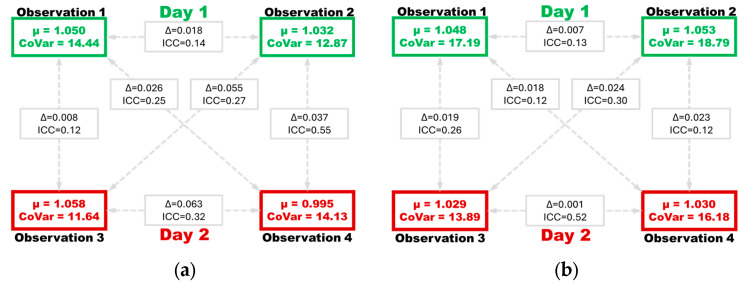
Figure 3.
Showing the mean (µ) coefficient of variation (CoVar) time to maximum constriction (tMC) values during each observation period, as well as the mean difference (∆) and intraclass correlation coefficient (ICC) values of each comparison, showing left eye values (a) and right eye values (b) separately.

