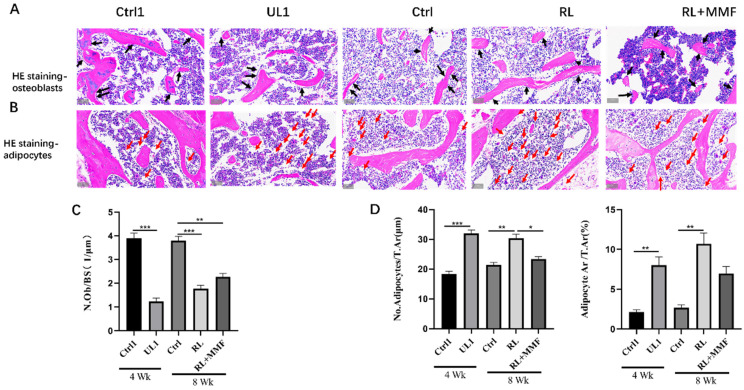
Figure 2.
The number of osteoblasts and adipocytes in the bone marrow of femur were evaluated. (A,B) The femoral sections were subjected to H&E staining to visualize osteoblasts and adipocytes. Black arrows indicate osteoblasts. Red arrows indicate adipocytes. Scale bar = 50 μm. Osteoblastogenesis were evaluated by the osteoblast number per bone surface (N.Ob/BS) in the trabecular bone; (C) Adipogenesis was evaluated by the adipocyte number per bone surface (No. Adipocytes/T.Ar) and adipocyte surface per bone surface (Adipocyte.Ar/T.Ar) in the bone marrow (D). n = 3. All the data are shown as mean ± SEM. * p < 0.05, ** p < 0.01, *** p < 0.001.

