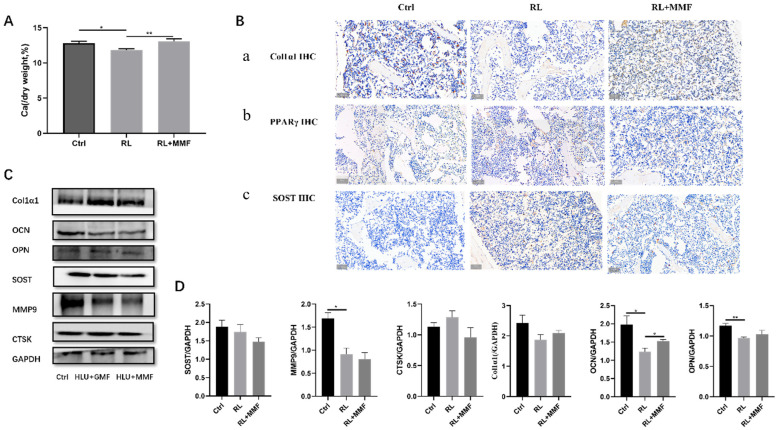
Figure 3.
Bone metabolism of MMF on the femur of HLU reloading mice. (A) Total calcium content in the tibia of HLU reloading mice. (B) Immunohistochemical staining of Col1α1, PPARγ, and SOST. Scar bar = 50 μm. Brown color indicates positive expression. (C) Protein expression of osteogenic and osteoclast-related proteins in the tibia of HLU reloading mice; (D) Quantitative statistics of protein expression of (A). n = 4–6. Data are shown as the mean ± SEM. * p < 0.05, ** p < 0.01.

