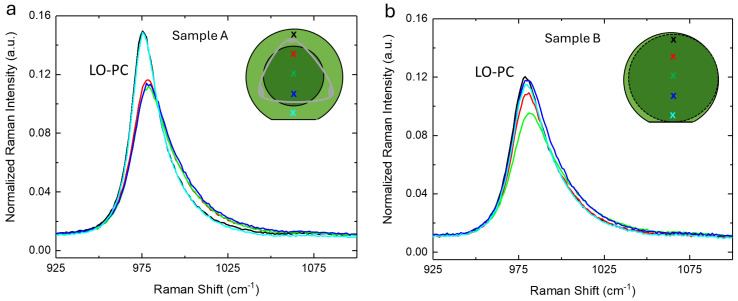
Figure 1.
(a) Normalized micro−Raman spectra of substrate A along the diameter in the range 925–1100 cm−1. (b) Normalized micro−Raman spectra of substrate B along the diameter in the range 925–1100 cm−1. The spectra are normalized to the TO band at 780 cm−1 amplitude. The graphical representations of the substrates are inserted in both panels. The color of the spectra refer to the positions where they were acquired, which are marked by an x of the same color on the graphical representation.

