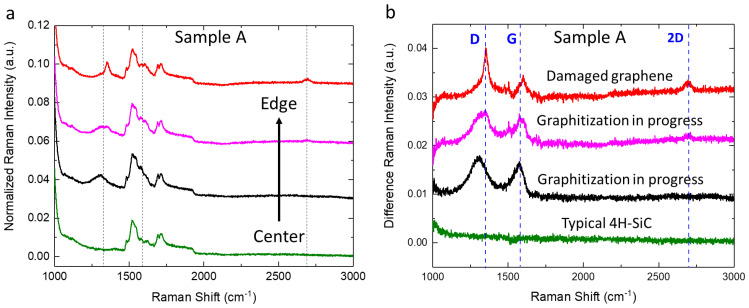
Figure 2.
(a) Normalized micro−Raman spectra, with respect to TO amplitude band, of substrate A in different radial positions subsequent to thermal treatment at 1650 °C in the range of the second-order Raman peaks. Specifically, the green spectrum corresponds to a circular area with a 3 cm diameter centered on the wafer, the pink spectrum to positions 1–2 cm from the edges, the red spectrum to the edges, and the black spectrum to the remaining surface area. Dashed lines are reported as guides for the eye to mark relevant spectral positions. (b) Normalized micro-Raman spectra of Figure 2a after the subtraction of the reference spectrum of 4H-SiC. The dashed lines labeled D, G, and 2D indicate the Raman peaks associated with graphene.

