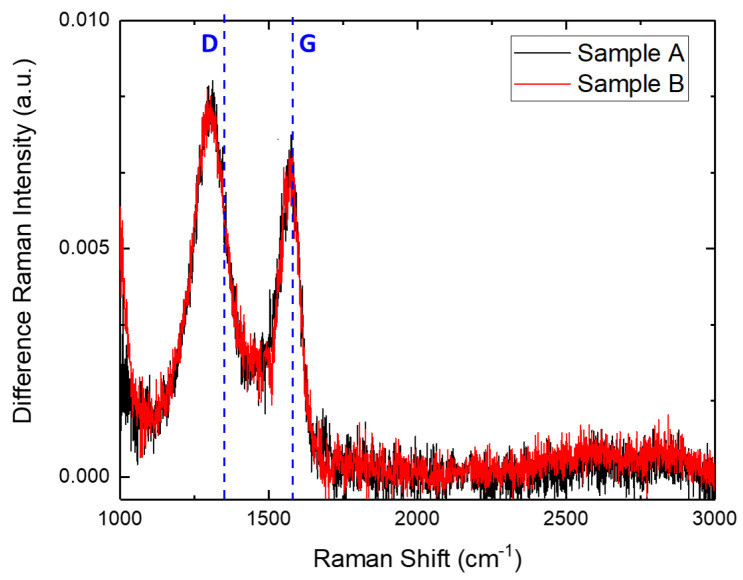
Figure 3.
Normalized micro-Raman spectra, with respect to TO amplitude band, in the range of the second-order Raman peaks of sample A (black) and sample B (red) after the subtraction of the 4H-SiC reference spectrum. The spectra were acquired from positions with the same doping level. The dashed lines labeled D and G indicate the Raman peaks associated with graphene.

