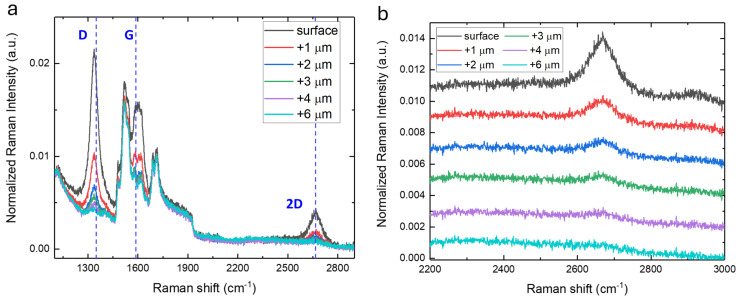
Figure 4.
(a) Micro−Raman measurements in the range of the second−order Raman peaks, normalized with respect to the TO amplitude band, acquired on a point of the edge of sample A, varying the z-positions underneath the sample surface. (b) Zoom in the 2200–3000 cm−1 range of the spectra in panel (a). The spectra are vertically shifted for convenience.

