Figure 5.
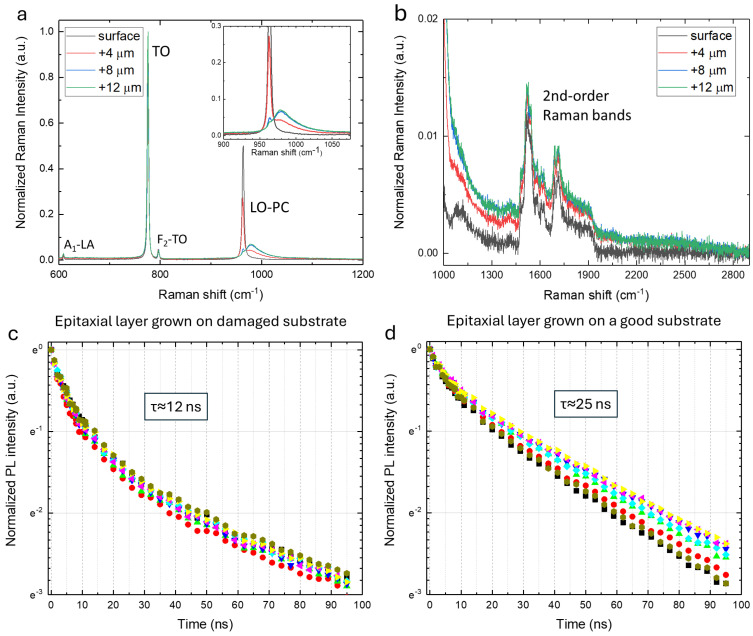
(a) Micro-Raman measurements, normalized with respect to the TO amplitude band, acquired at different positions underneath the epitaxial layer surface grown on one of the thermally treated damaged substrates. The spectrum collected at 12 μm is in correspondence with the interface between the substrate and epitaxial layer, and the inset reports a zoom of the LOPC band. (b) Zoom of the 1000–2900 cm−1 range of the spectra in panel (a). (c) Photoluminescence time decay (excitation wavelength 266 nm) of the excitonic band recorded at different positions (reported with different colors) on the epitaxial layer grown on the damaged substrates. (d) Photoluminescence time decay (excitation wavelength 266 nm) of the excitonic band recorded at different positions (reported with different colors) on the epitaxial layer grown on a high-quality substrate.

