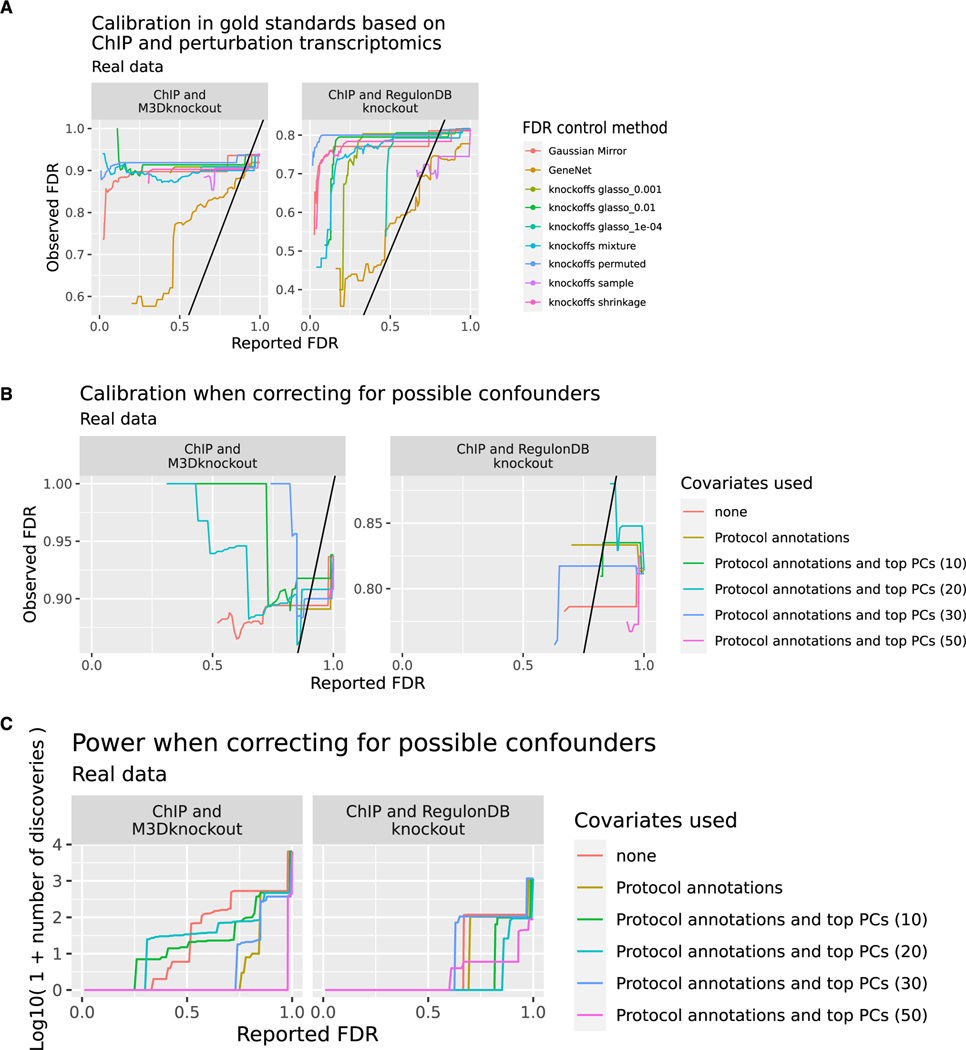
Figure 4. Diverse methods do not control FDR in TRN inference.
(A) Comparison of FDR reported by each method (x axis) and observed FDR (y axis) across different methods and gold standards. The observed FDR is calculated across hypotheses that are testable using an intersection of target gene sets from ChIP and perturbation transcriptomics experiments. M3DKnockout refers to the genetically perturbed samples from the Many Microbe Microarrays Database57 while RegulonDBKnockout refers to genetically perturbed samples downloaded from RegulonDB. When fewer than 10 testable hypotheses are returned below a given reported FDR, the observed FDR is highly uncertain, and we leave the left part of the plot blank. The colors indicate different methods of FDR control. Analysis is based on n = 805 microarray profiles.
(B) Reported and observed FDR when correcting for labeled and unlabeled indicators of confounding. Knockoffs are constructed using the glasso_1e—04 method conditioning on no covariates, on labeled perturbations, or on both labeled perturbations and the top (10, 20, 30, 50) principal components of the full expression matrix. When fewer than 10 testable hypotheses are returned below a given reported FDR, the observed FDR is highly uncertain, and we leave the left part of the plot blank. The colors indicate which confounders were controlled for. Analysis is based on n = 805 microarray profiles.
(C) Power (number of discoveries) in the same analysis shown in (B). The colors indicate which confounders were controlled for. Analysis is based on n = 805 microarray profiles.

