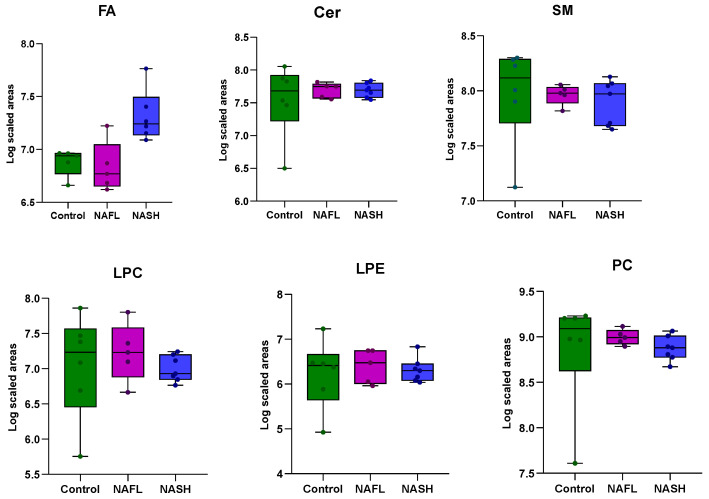
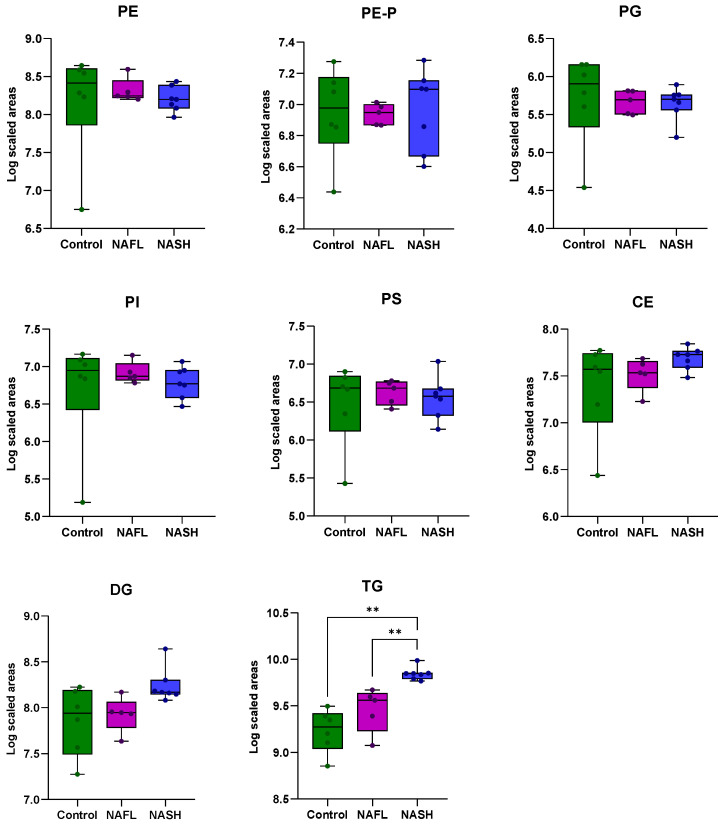
Figure 2.
Lipid class composition (in normalized peak areas; log10 scaled) of liver biopsies in the three main groups of the study. The total abundance of each lipid class was calculated by adding up peak areas of lipid species. Boxes highlight the values between 25% and 75% quartiles; vertical lines connect minimum and maximum values. Statistically significant difference was observed in the class of TGs between controls and NASH (** p-value = 5.2 × 10⁻⁶) and in NAFL–NASH patients (** p-value = 4.25 × 10⁻⁴).


