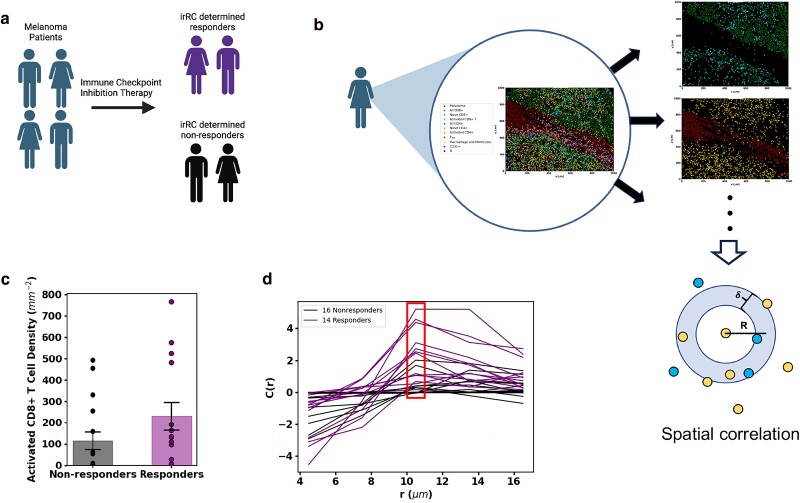
Fig. 1.
Selection of cell types by analyzing patient slides. a) Patients with melanoma underwent ICI therapy and were characterized as either responders or nonresponders to therapy according to irRC. b) The dataset provides an IMC snapshot of each patient TME. We quantitatively evaluate the relationship between response to therapy and the spatial distributions of each cell type/pairs of cell types. We find the densities of each cell type in every slide as well as the spatial correlation (graphic aid below slides) between every permutation of two cell types. Graphic aid for the spatial correlation calculation: the density of blue cells around each yellow cell at radius R in an annulus of thickness δ is calculated for each yellow cell and averaged across all yellow cells. The total slide density of blue cells is then subtracted from that average to find if the density of blue cells around the average yellow cell is above or below that expected from a random distribution of blue cells. Finally, this value is divided by the average number of blue cells across all slides. Figures (a-b) were created with BioRender.com. c) The activated CD8+ T-cell density in slides corresponding to patients who did or did not respond to ICI therapy. The average activated CD8+ T-cell density (represented with box) among responders is higher than that of the nonresponders. The averages are different with P-value 0.1504. Because activated CD8+ T densities differ between responders and nonresponders, we consider activated CD8+ T cells a relevant cell population. d) The plot of spatial correlation between macrophages/monocytes and activated CD8+ T cells shows that at a distance of 10.5 μm (about the distance to a nearest neighbor), macrophages/monocytes find on average more activated CD8+ T-cell neighbors in responders than in nonresponders. The average spatial correlation values at 10.5 μm are different with a P-value of 0.0005. This difference between responders and nonresponders to ICI in the spatial distribution shows the relevance of the cell types, macrophages/monocytes and activated CD8+ T cells, and their spatial distribution.

