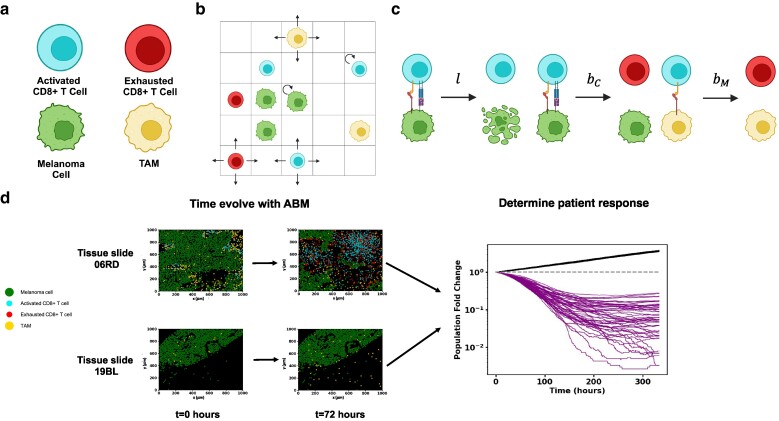
Fig. 2.
Schematic of model and approach to parameter estimation and hypothesis testing. a) The four cell types in the model: including melanoma cells, activated CD8+ T cells, exhausted CD8+ T cells and TAMs. b) Schematic depicting melanoma cells, macrophages, activated CD8+ T cells, and exhausted CD8+ T cells on the ICS lattice. CD8+ T cells and macrophages are free to diffuse around the slide. c) Cell–cell interactions in the model include lysis of melanoma cells by activated CD8+ T cells at rate l, exhaustion of activated CD8+ T cells by melanoma cells at rate and exhaustion of activated CD8+ T cells by TAMs at rate . Rates and rules are given in Table S1. Figures (a), (b) and (c) were created with BioRender.com. d) Shows spatial locations of melanoma cells, macrophages, cytotoxic CD8+ T cells, and exhausted CD8+ T cells from IMC data of human melanoma biopsies taken before ICI treatment and corresponding computationally time-evolved samples after 2 days. Top: IMC slide 06RD corresponding to a responder. Bottom: IMC 19BL corresponding to a nonresponder. Right: Melanoma cell population trajectories in time for 50 samples for each of the 2 slides. The 19BL samples display cancer growth showing nonresponse, and the 06RD samples display cancer regression, which is an example of response.

