Fig. 3.
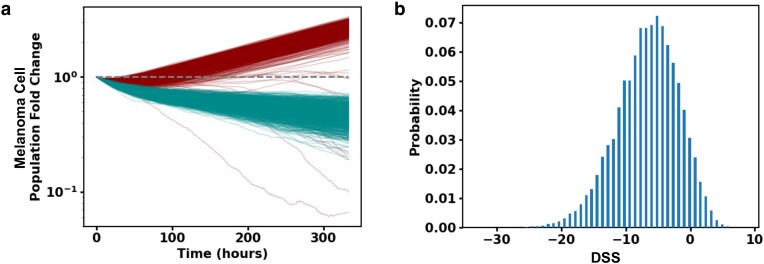
Hypothesis testing with ICS model and patient response data suggests TAM and melanoma cell–induced exhaustion of CD8+ T cells regulate response to ICI drugs. a) Melanoma cell fold change (log-linear plot) trajectories plotted as a function of time for 1,000 simulations of slide 33RD performed with the trained full model (dark red) and with the trained model with TAM exhaustion of activated CD8+ T cells turned off (dark cyan). b) Shows the distribution of DSS (defined in the Materials and Methods section) over 100,000 bootstrap samples to test the hypothesis that the prediction power of the full model is the same as in the model without TAM exhaustion of activated CD8+ T cells. The hypothesis is rejected with P-value 0.070. DSS distribution for the model without exhaustion of CD8+ T cells by melanoma cells is shown in Fig. S2.

