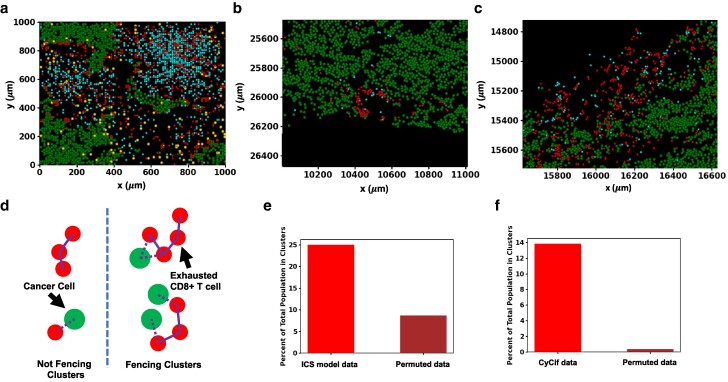
Fig. 5.
Fencing of tumor boundaries with exhausted CD8+ T cells in the ICS model and CyCIF imaging data of TMA slides from melanoma patients. a) A sample of slide 06RD at 72 h of simulation shows exhausted CD8+ T-cell fencing. b, c) All melanoma, cytotoxic CD8+ T cells and exhausted CD8+ T cells are plotted for a subsection of slide MEL06 (10). Exhausted CD8+ T-cell fencing in the model is supported by the presence of linings of exhausted CD8+ T cells along the boundary of the tumor in MEL6 blocking access to their cytotoxic counterparts. In general, exhausted CD8+ T cells border the melanoma cells more often than cytotoxic CD8+ T cells. This may lead to a reduction of cytotoxic function in vivo. d) Illustration of fencing and nonfencing clusters with exhausted CD8+ T cells and melanoma cells. The two clusters of exhausted CD8+ T cells on the left, considered to be nonfencing, are either not in contact with melanoma cells or do not have enough cells in the cluster. The two clusters on the right meet the criteria for being fencing clusters. e) Shows the fencing metric for ICS model data alongside that for randomly a permuted distribution of exhausted CD8+ T cells. When the spatial distribution of exhausted CD8+ T cells is randomly permuted with all CD8+ T cells and TAMs in the simulation the percentage of exhausted CD8+ T cells contributing to fencing in slide 06RD at 72 h is considerably reduced when compared with the actual distribution. f) Shows the fencing metric for the CyCif data alongside that for randomly a permuted distribution of exhausted CD8+ T cells. The percentage of all exhausted CD8+ T cells contributing to fencing in slide MEL06 is similarly greatly reduced when the distribution of exhausted CD8+ T cells is randomly permuted with all identified cells except melanoma cells. The color scheme separating cell types in the tumor slides (a), (b) and (c) are the same as those used in Figure 2a.

