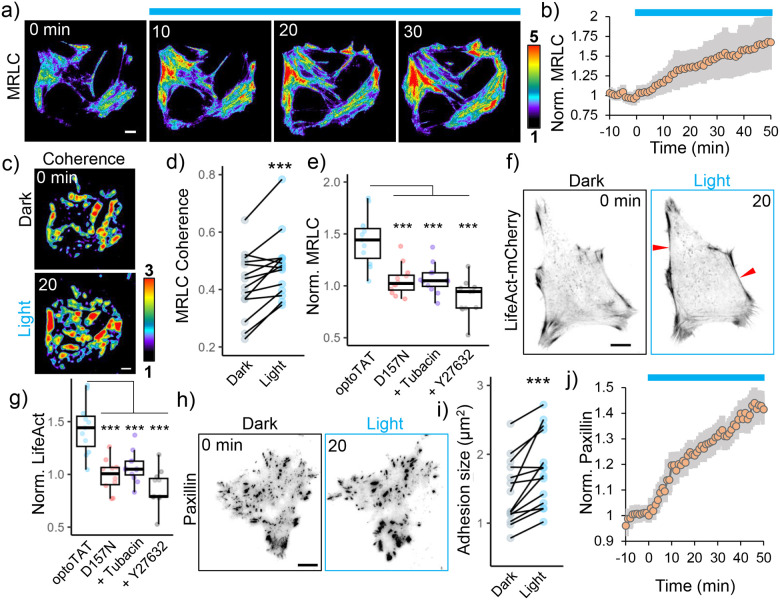
Figure 4. OptoTAT stimulation rapidly induces actomyosin contractility.
a) TIRF images showing temporal changes in mCherry-MRLC distribution on miRFP703-optoTAT stimulation in HeLa cells; b) Changes in mCherry-MRLC intensity on miRFP703-optoTAT stimulation, mean ± 95% C.I. are shown, n = 14 cells, c), d) Changes in MRLC distribution isotropy on miRFP703-optoTAT stimulation, n = 14 cells; e) Changes in mCherry-MRLC intensity in TIRF plane on 30 min blue light stimulation of miRFP703-optoTAT (14 cells), catalytically dead miRFP703-optoTAT(D157N) (12 cells), miRFP703-optoTAT and pre-treatment with 2 μM Tubacin (12 cells) or 10 μM Y27632 (12 cells); f) Changes in LifeAct-mCherry on miRFP703-optoTAT stimulation, red arrowheads indicate bundled actin; g) Changes in LifeAct-mCherry intensity in TIRF plane on 30 min blue light stimulation of miRFP703-optoTAT (12 cells), catalytically dead miRFP703-optoTAT(D157N) (12 cells), miRFP703-optoTAT and pre-treatment with 2 μM Tubacin (12 cells) or 10 μM Y27632 (10 cells), h) Changes in mCherry-Paxillin on miRFP703-optoTAT stimulation, i) Changes in average focal adhesion sizes and j) changes in average mCherry-Paxillin intensity on 30 min miRFP703-optoTAT stimulation, mean ± 95% C.I. are shown, n = 14 cells. Scale bar: 10 μm. ***: p<0.001. Blue line: Blue light stimulation.

