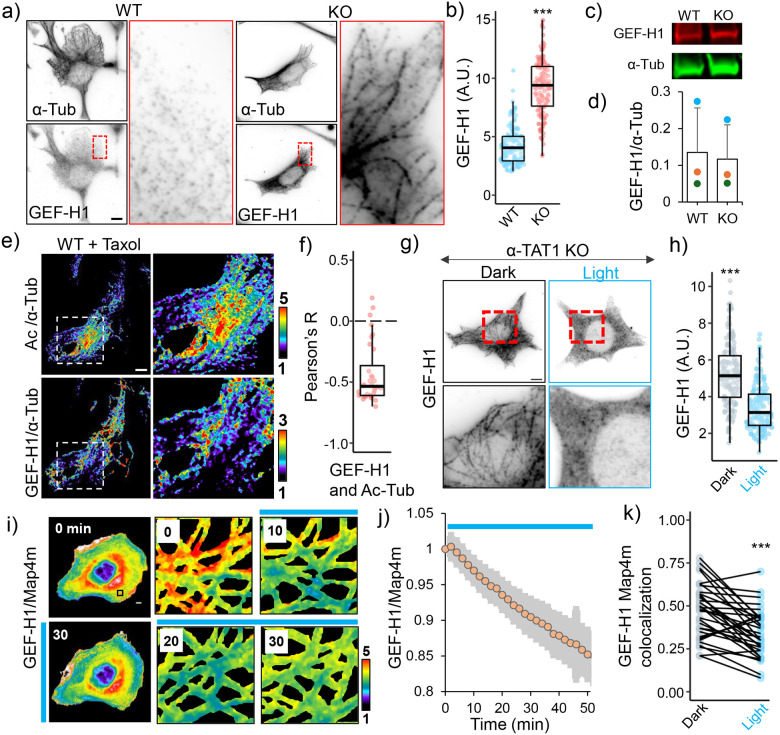
Figure 5. Microtubule acetylation releases GEF-H1 sequestration.
a) α-Tubulin and GEF-H1 localization in WT and α-TAT1 KO MEFs, inset for GEF-H1 is magnified on right; b) linear density of GEF-H1 along microtubules in WT and α-TAT1 KO MEFs (5 microtubules from 30 cells each, total 150); c), d) GEF-H1 expression levels in WT and α-TAT1 KO MEFs measured using western blots (3 independent experiments, error bar: standard deviation); e) Relative distributions of acetylated microtubules (top panel) and microtubule-bound GEF-H1 (bottom panel) in overnight 100 nM Taxol treated WT MEFs, inset magnified on the right panels; f) Pearson’s R value for spatial colocalization of acetylated microtubules and microtubule-bound GEF-H1 in Taxol treated WT MEFs, n = 33 cells; g) GEF-H1 localization in α-TAT1 KO MEFs stably expressing mVenus-optoTAT kept in dark or with 30 min blue light stimulation; h) linear density of GEF-H1 along microtubules in α-TAT1 KO MEFs stably expressing mVenus-optoTAT kept in dark or exposed to 30 min blue light stimulation (5 microtubules from 30 cells each, total 150); i) Changes in mCherry-GEF-H1/mVenus-MAP4m signal in HeLa cells expressing miRFP703-optoTAT on blue light stimulation, inset is magnified in the right panels; j) Temporal changes in mCherry-GEF-H1/mVenus-MAP4m on miRFP703-optoTAT stimulation, mean ± 95% C.I. are shown, n = 33 cells; k) Changes in colocalization of mCherry-GEF-H1 and mVenus-Map4m on miRFP703-optoTAT stimulation for 30 min, n = 33 cells. Scale bar: 10 μm. ***: p<0.001

