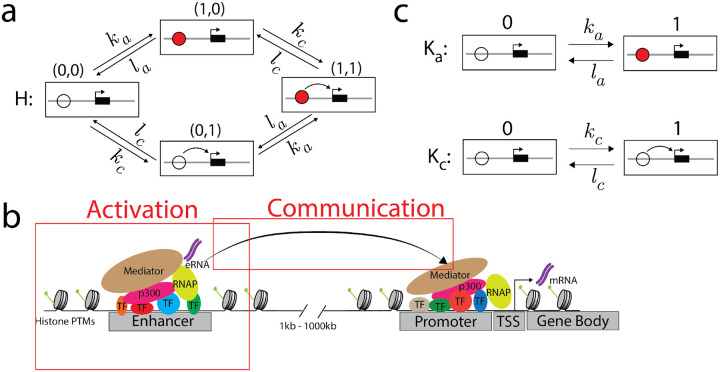
Figure 1:
The activation-communication coarse graining. a) An example linear framework graph, , representing a coarse-grained view of an enhancer. Each vertex contains a schematic of the enhancer (circle) and its target gene (black rectangle with the transcription start site marked with an arrow). The enhancer may be activated (filled red circle) or communicating (curved arrow to the target gene), encoded in the notation used to denote vertices. The edge labels show that activation and communication take place independently of each other. b) A more detailed picture of the molecular complexity that may underlie the coarse-grained graph in panel a, as described further in the text. c) The example graph in panel a is the graph product of two simpler 2-vertex graphs, , which represents activation, and , which represents communication. The product structure of is equivalent to the independence of activation and communication.

