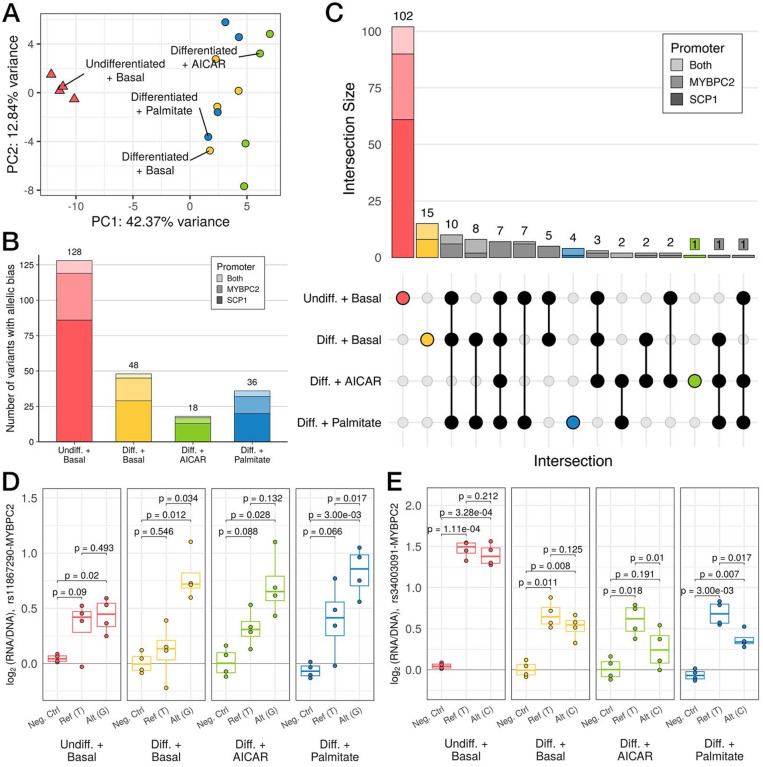
Figure 3. Variation in regulatory activity measured by MPRA recapitulates whole-transcriptome patterns.
(A) Principal components analysis (PCA) of MPRA activity across 860 oligos. (B) Stacked bar plot displaying the number of variants that display differences in regulatory activity across both alleles (i.e., allelic bias), as measured by MPRA (FDR < 5%). Bar plot shading corresponds to which promoter a variant was paired with when it demonstrated allelic bias (light shade: both, medium shade: MYBPC2, dark shade: SCP1). Total number of variants for each condition is listed above the corresponding bar. (C) UpSet plot shows counts of variants showing allelic bias in each subset of conditions (filled dots). (D,E) MPRA signals with log2(RNA/DNA) plotted vs alleles (Ref: reference, Alt: alternate) or a negative control, for (D) an example of allele-specific activity favoring the alternate allele primarily in differentiated conditions; and (E) a stimulation-specific example. (p-values in (C) and (D) from post hoc pairwise t-tests after passing mpralm 5% FDR threshold; N = 4 replicates per group)

