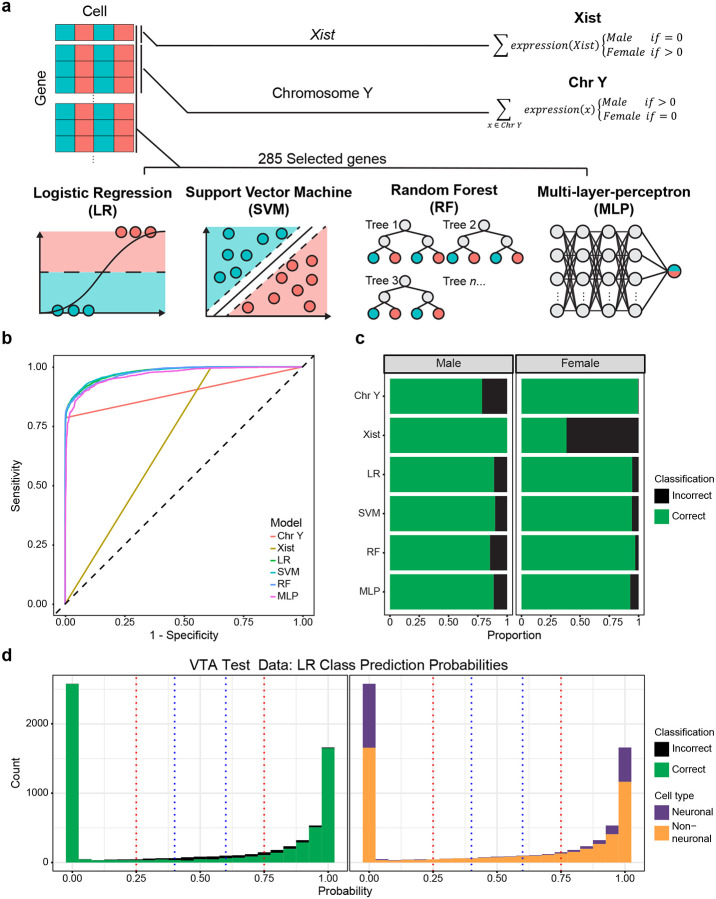
Figure 3.
Machine learning models using selected genes outperform simple classifiers in sex classification. a, Schematic of models evaluated, the predictor genes used, and classification framework. b, Receiver operating characteristic curve of model sensitivity and specificity for classification of the VTA testing data partition. c, Stacked bar chart of the proportion of correct and incorrect classifications of the VTA testing data partition sexes. d, Histogram of logistic regression predicted cell sex probabilities (closer to 1 = high probability of being female, closer to 0 = high probability of being male) for the VTA test partition, bin size = 0.05. Blue and red dotted lines represent thresholds of 0.4–0.6 and 0.25–0.75 respectively. Bins are colored by the proportion of incorrect/correct classifications (left) and cell types (right).

