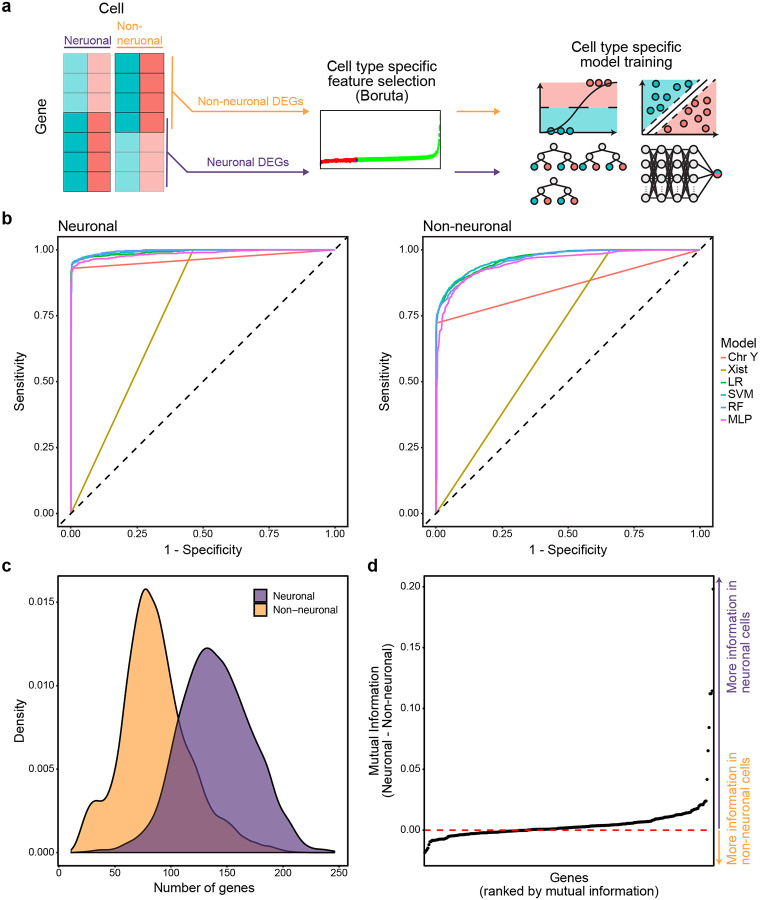
Figure 4.
Cell type-specific models mirror the performance trends of models trained on all cells. a, Schema for cell type-specific model training strategy. b, Reciever operating characteristic curves of cell type-specific model sensitivity and specificity for classification of neuronal (left) and non-neuronal cells (right) of the VTA testing data partition. c, Distribution of the number of model predictor genes expressed in neuronal and non-neuronal cell populations of the VTA training data. d, Difference of mutual information score, calculated as mutual information of gene expression and sex, between neuronal and non-neuronal cells of the VTA training data partition.

