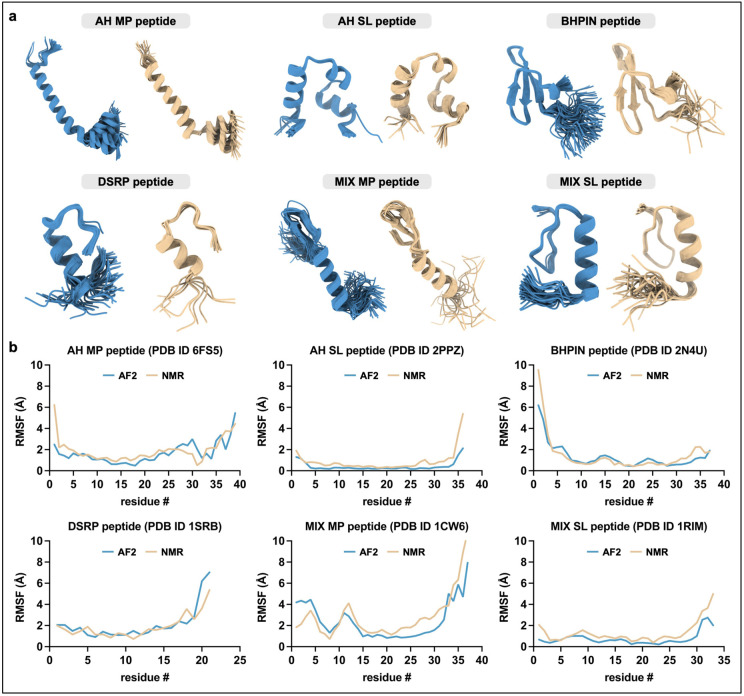
Fig. 2: Exemplary peptide structural conformation predictions.
(a) AF2-predicted (blue) and NMR-determined (beige) conformational ensembles of exemplary peptides from each of the six peptide groupings: AH MP (PDB ID 6FS5) [13], AH SL (PDB ID 2PPZ) [14], BHPIN (PDB ID 2N4U) [15], DSRP (PDB ID 1SRB) [16], MIX MP (PDB ID 1CW6) [17], and MIX SL (PDB ID 1RIM) [18]. (b) Cα RMSF comparisons between AF2-predicted (blue lines) and NMR-determined (beige lines) conformational ensembles corresponding to the peptides depicted in (a). Global values for each peptide are as follows: AH MP, 0.607 Å; AH SL, 0.455 Å; BHPIN, 0.433 Å; DSRP, 0.506 Å; MIX MP, 1.038 Å; MIX SL, 0.561 Å. Cα RMSD values for each peptide are as follows: AH MP, 1.759 Å; AH SL, 2.152 Å; BHPIN, 1.212 Å; DSRP, 2.621 Å; MIX MP, 2.633 Å; MIX SL, 1.410 Å.

