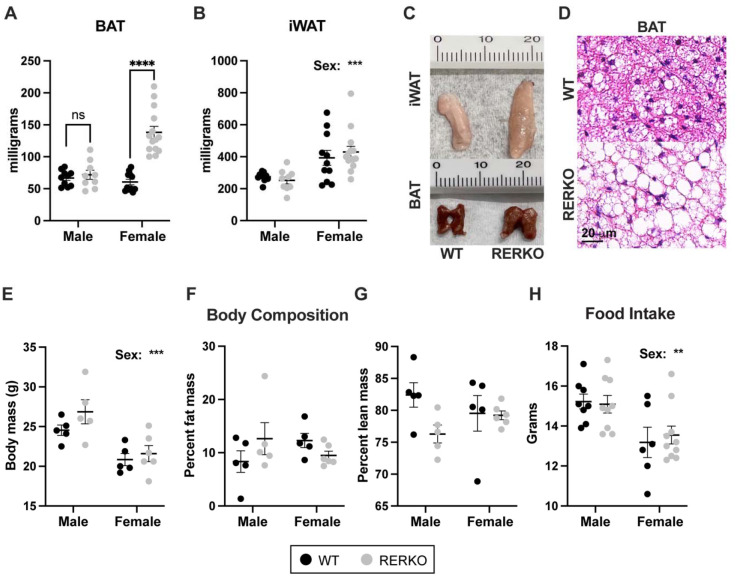
Figure 2. Esr1 KO in Rprm lineage cells (RERKO) sex-specifically alters brown adipose tissue.
(A,B) BAT (A) and iWAT (B) mass from adult male and female control littermates (black dots) and RERKO mice (gray dots). N = 10 WT males, 11 WT females, 9 RERKO males, and 14 RERKO females. (C) Representative images of iWAT (top) and BAT (bottom) in WT (left) and RERKO (right) mice. Ruler with centimeters added for scale. (D) Representative images of hematoxylin and eosin staining of WT (top) and RERKO (bottom) in 8-week-old mice. Scale = 20 μm. (E-G) Body composition analysis of male and female WT and RERKO mice at 16 weeks of age via EchoMRI: body mass (E), percent fat mass (F), and percent lean mass (G). N = 5 WT males, 5 WT females, 5 RERKO males, and 6 RERKO females. H) Food consumption averaged over seven days in WT and RERKO mice. N = 8 WT males, 6 WT females, 9 RERKO males, and 10 RERKO females. The mean and standard error of the mean are depicted on all graphs, as well as individual data points. Two-way ANOVAs used for statistical analysis; differences between WT and RERKO tested within each sex using Šídák’s multiple comparisons test following a significant interaction. ** p < .01, *** p < 0.001, **** p < 0.0001.

