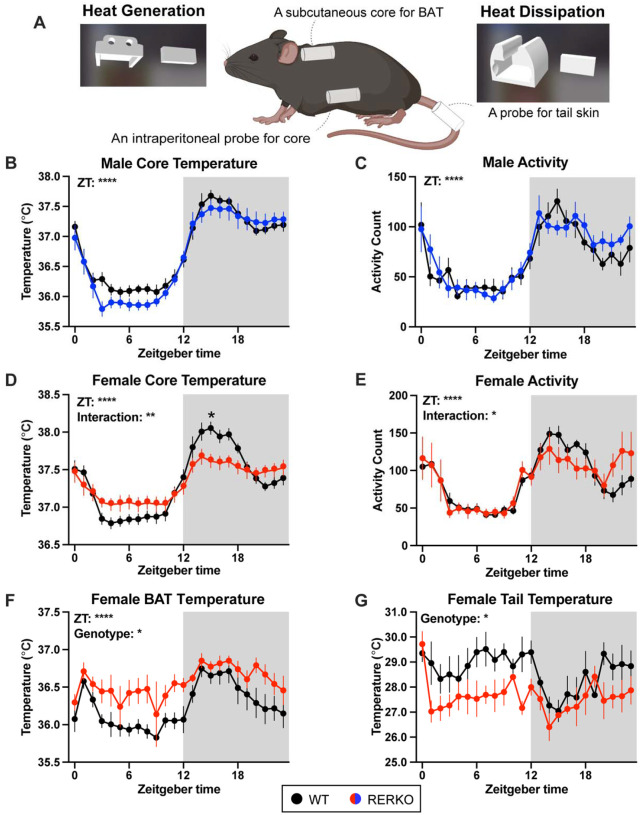
Figure 3. KO of Esr1 in Rprm lineage cells sex-specifically impacts thermoregulation.
(A) Illustration of a mouse implanted with an intraperitoneal probe to record temperature and locomotion. In addition, a probe is placed above the BAT and on the base of the tail to measure heat generation and heat dissipation, respectively. Custom 3d printed sleeves are used to secure the probes. (B-E) Core body temperature in Celsius or activity counts of WT siblings (black) and RERKO mice (males in blue; females in red) averaged hourly across 24 hours. N = 8 WT males, 8 RERKO males, 11 WT females, 10 RERKO females. (F, G) Temperature averaged hourly above the BAT or at base of the tail in female control (black) and RERKO (red) across 24 hours. N for BAT data = 8 WT, 8 RERKO. N for tail data = 4 WT, 4 RERKO. Mean and standard error of the mean plotted at each time point. Two-way mixed ANOVAs used for statistical analyses. Significant interaction followed by Šídák’s multiple comparisons at each time point. ZT = Zeitgeber time. C = Celsius. Shaded box indicates the dark (active) phase of the day.

