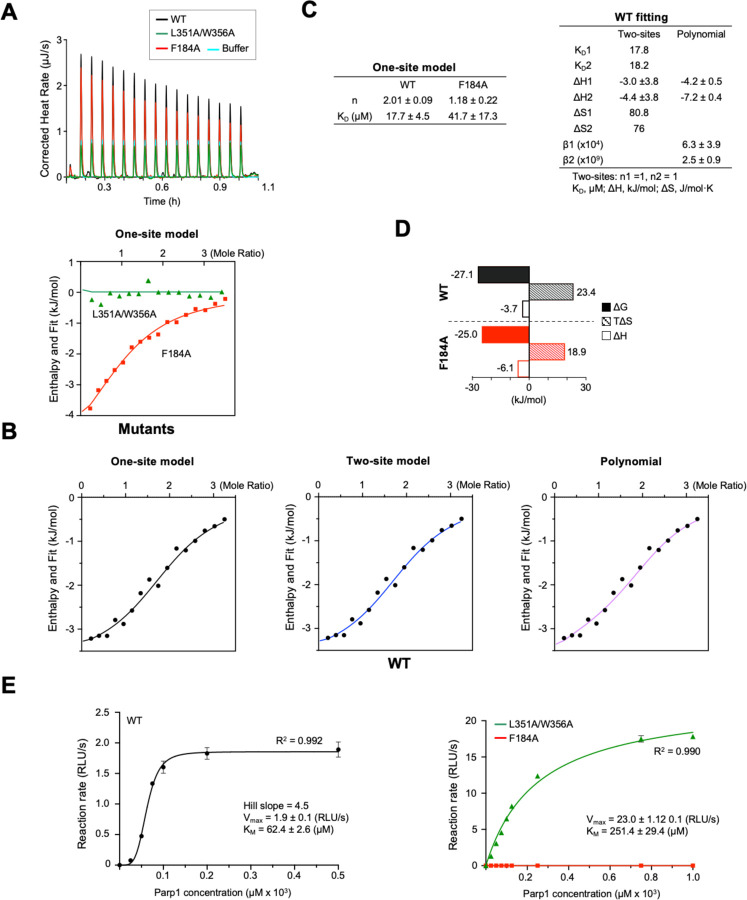
Fig. 5. The secondary binding site exerts allosteric regulation.
(A) Raw data of ITC analysis of the binding between SMYD2 proteins and the PARP1 peptide, including the control titration. (B) ITC binding isotherms with normalized heat changes. Top panel: F184A and L351A/W356A data were fitted with the one-site model (red line) and the blank model (green line), respectively. Bottom panel: Wild-type SMYD2 data were fitted with the one-site (left), two-site (middle), and binding polynomial (right) models. (C) Thermodynamic parameters estimated from model fitting. (D) Entropic and enthalpic contributions to the binding free energy. (E) Steady-state enzyme kinetics of SMYD2 proteins with the PARP1 peptide as the substrate. Each data point represents the average of three replicates; error bars represent the standard error. The luminescence readings, expressed as RLU (relative light unit), indicate enzymatic activities. Wild-type SMYD2 data were fitted to the Hill equation (black line). L351A/W356A and F184A data were fitted to the Michaelis-Menten equation (green and red lines). Enzyme kinetic parameters are shown.

