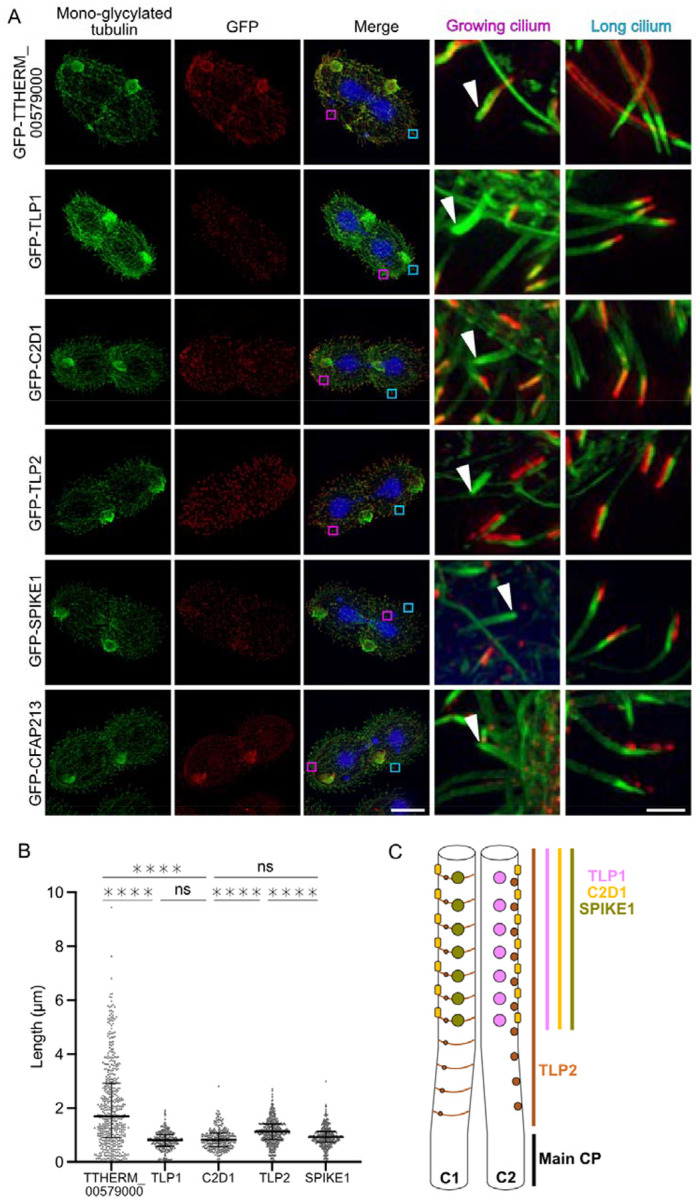
Figure 2: The proteins identified by DomainFit localize to the tips in vivo.

(A) Representative fluorescence images of mono-glycylated tubulin (green), GFP-tagged TTHERM_00579000 (DPY-30 motif protein), TLP1, C2D1, TLP2, SPIKE1 and CFAP213 (red), and DNA (blue) and merged images. Scale bar: 20 μm. Insets show both a growing cilium (pink square in the merged image) and a long cilium (blue square in the merged image). Scale bar: 1.5 μm (B) Quantification of the signal length for each protein except for CFAP213. Number of measurements: n=485, 261, 278, 419 and 334 for DPY-30 (TTHERM_00579000), TLP1, C2D1, TLP2 and SPIKE 1, respectively. The horizontal bars indicate the medians. The error bars indicate the interquartile ranges. **** p<0.0001, Kruskal Wallis test. CFAP213 fluorescence was not quantified because of its appearance as spots. (C) Diagram showing the distribution of the tip proteins along the length of the tip CP.
