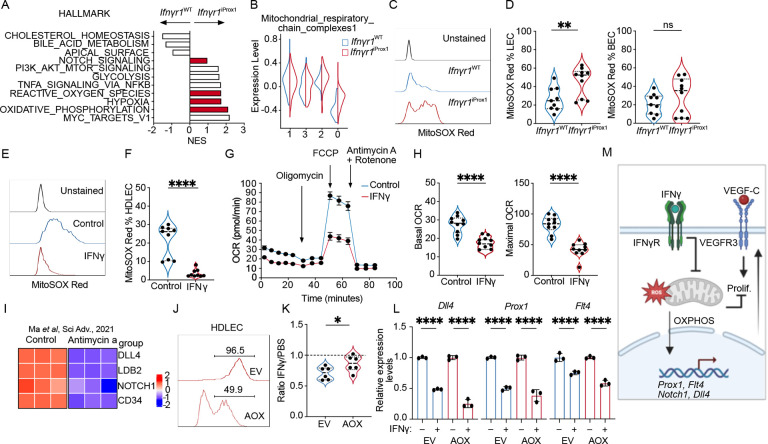
Figure 5. IFNγ inhibits proliferation through effects on mitochondrial respiration.
A. Pathway analysis of differentially expressed genes in cluster 0 between Ifnγr1WT and Ifnγr1iProx1 LECs from Fig. 4. B. Mitochondrial respiratory chain complex module score as a function of cluster and experimental group. C. Representative histogram of Mitosox Red staining in tumor-associated LECs (LEC; CD45−CD31+gp38+) from B16-OVA-VEGFC tumors from Ifnγr1WT and Ifnγr1iProx1 mice. D. Mitosox Red quantification in LEC and blood endothelial cells (BEC; CD45CD31+gp38−) from B16-OVA-VEGFC tumors from Ifnγr1WT and Ifnγr1iProx1 mice, each point represents a mouse, (n=9–10). E. Representative histogram and F. quantification of Mitosox Red in HDLEC treated with PBS or IFNγ (72 hrs). G. Seahorse analysis of IFNγ-conditioned (48hrs) HDLECs relative to PBS-treated controls. H. Basal and maximal oxygen consumption rate (OCR) from (E). I. Heatmap of tip-like genes from bulk RNA sequencing data of HDLECs treated with PBS or antimycin-a scaled and reanalyzed (Ma et al Sci Adv 2021). J. Representative histogram of HDLECs transduced with empty vehicle control (EV-RFP) or a plasmid expressing the alternative oxidase (AOX-RFP). K. Quantification of RFP+ EV and AOX HDLEC numbers after treatment with IFNγ (72 hrs), presented relative to PBS controls. L. Dll4, Prox1, Flt4 expression in sorted EV-RFP or AOX-RFP transduced HDLECs after IFNγ or PBS treatment. M. Schematic illustration of the role of IFNγ on proliferation and transcriptional control of selected genes. *p<0.05, **p<0.01, ***p<0.001, ****p<0.001.

