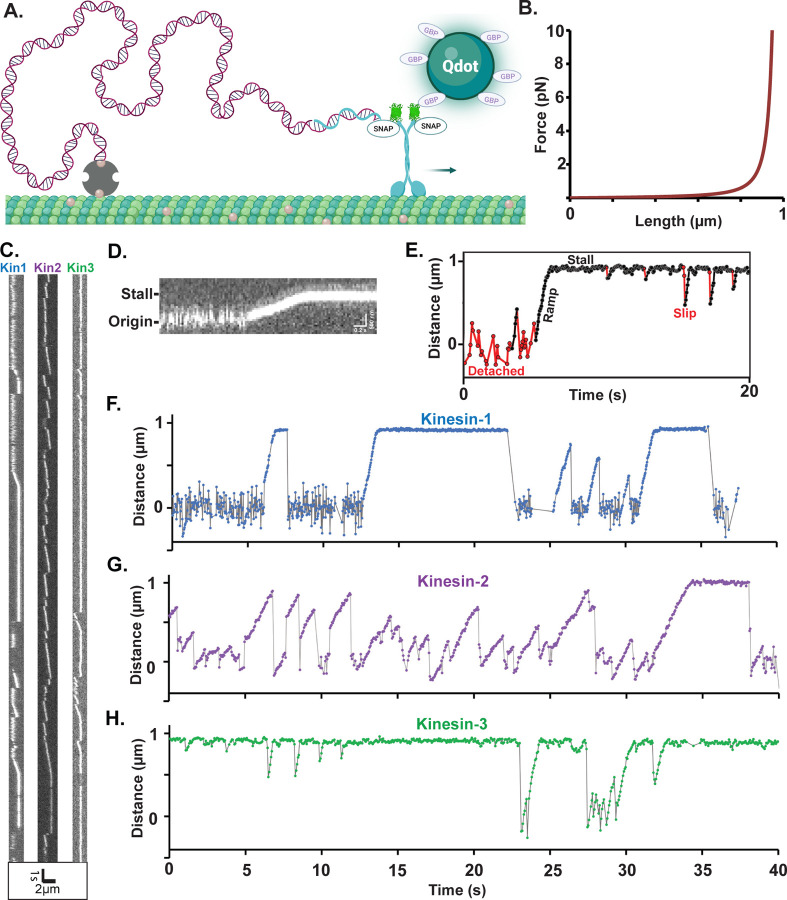
Figure 1. Experimental Design and Raw Data from Motor-DNA Tensiometers.
(A) Schematic of a motor-DNA tensiometer, consisting of a dsDNA (burgundy) connected on one end to a kinesin motor through a complimentary oligo (blue), and on the other end to the MT using biotin-avidin (tan and gray, respectively). A Qdot functionalized with GFP binding protein nanobodies is attached to the motor’s GFP tag and used to track motor position. (Not to scale; motor and Qdot are both ~20 nm and DNA is ~1 micron) (B) Predicted force extension curve for a worm-like chain 3009 bp dsDNA based on a 50 nm persistence length. (C) Representative kymographs of motor-DNA tensiometers for kinesins-1, -2 and -3. (D) Enlarged kymograph showing diffusion around the origin, ramp, and stall. (E) Example distance vs. time trace (kinesin-3), highlighting detached durations (red), ramps and stalls (black) where the motor has pulled the DNA taut, and transient slips during stall (red). (F-H) Representative distance vs. time plots for kinesin-1 (F), kinesin-2 (G) and kinesin-3 (H), corresponding to the kymographs in (C). Further examples are shown in Figure S3.

