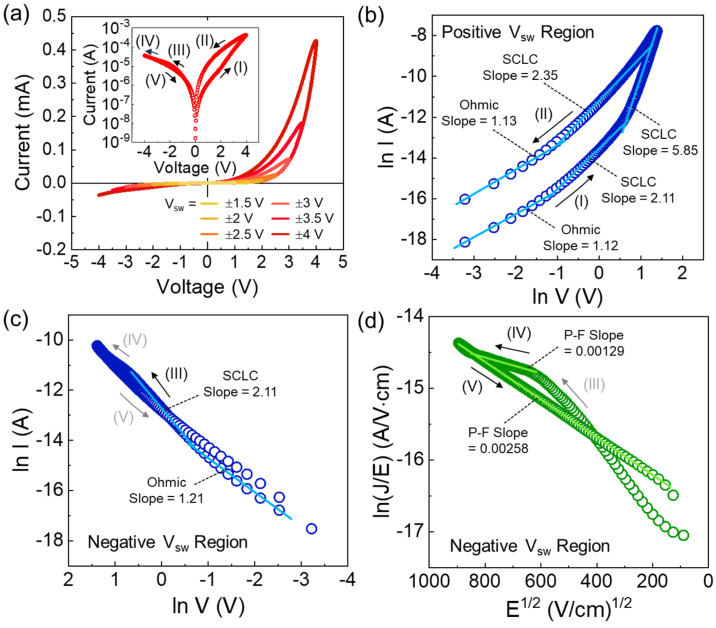
Figure 3.
(a) I–V characteristic curves of the Al/LiNbO3/Pt memristive synapse (LN-250) measured under various Vsw ranges. SCLC plots in the (b) positive and (c) negative Vsw regions. (d) P-F plot in the negative Vsw region. The inset in (a) illustrates the hysteretic behavior represented by the semi-logarithmic I–V curve.

