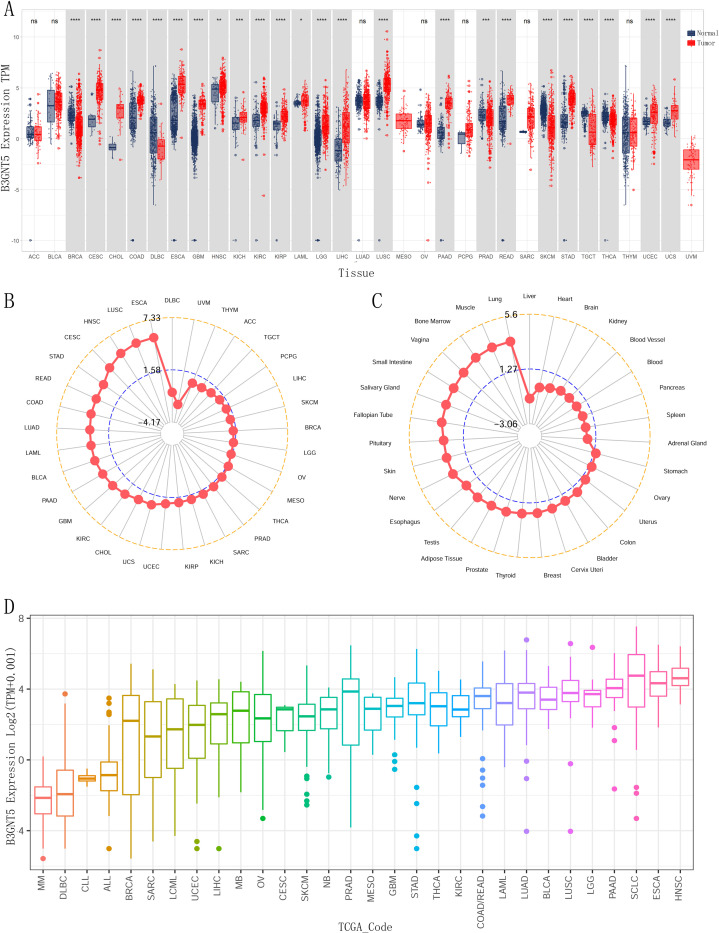
Fig 1.
The expression levels of B3GNT5 across pan-cancer were detailed as follows: (A) B3GNT5 expression in tumor tissues from The Cancer Genome Atlas (TCGA) and normal tissues from TCGA and Genotype-Tissue Expression (GTEx) databases. (B) B3GNT5 expression in tumor tissues from the TCGA database; (C) B3GNT5 expression in normal tissues from the GTEx database. (D) B3GNT5 expression in tumor cell lines from the Cancer Cell Line Encyclopedia (CCLE) database, with mean values represented by datapoints. Statistical significance was denoted by *p < 0.05, **p < 0.01, ***p < 0.001, and ****p < 0.0001, with "ns" indicated not significant.

