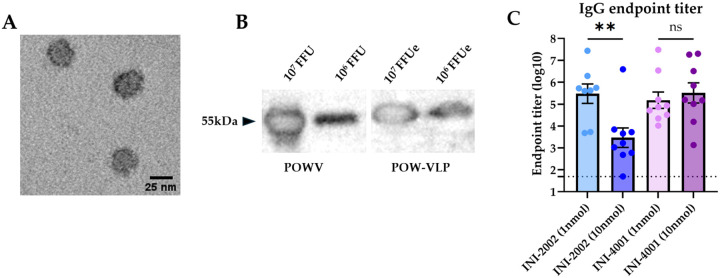
Fig 1. Quantifying VLPs and optimizing adjuvant concentrations for vaccination.
(A) Purified POW-VLP visualized by transmission electron microscopy. (B) SDS-PAGE and western blot of POWV (left) and POW-VLP (right) with T077 anti-TBEV-E antibody. Expected migration at 54 kDa. (C) Mice prime-boost vaccinated 2 weeks apart sc with 106 FFUe of VLP adjuvanted with either varying concentrations of INI-2002 or INI-4001, n=8–9/group. Serum collected 2 weeks post-vaccination and analyzed by whole-virus ELISA with anti-mouse IgG. Endpoint titers are log-transformed and reported as means ± SEM. Dotted line represents the least dilute serum tested (1:50). Statistical significance determined by one-way ANOVA and Šídák’s multiple comparisons test to compare doses within adjuvant treatment groups. Data represent two independent experiments.

